Project Reports
To view your project status along with existing issues, assess the effectiveness of auto-translation methods, estimate and count the translation cost, keep track of the most active members, and view historical data of previously generated reports, open your project and select Reports on the left sidebar.
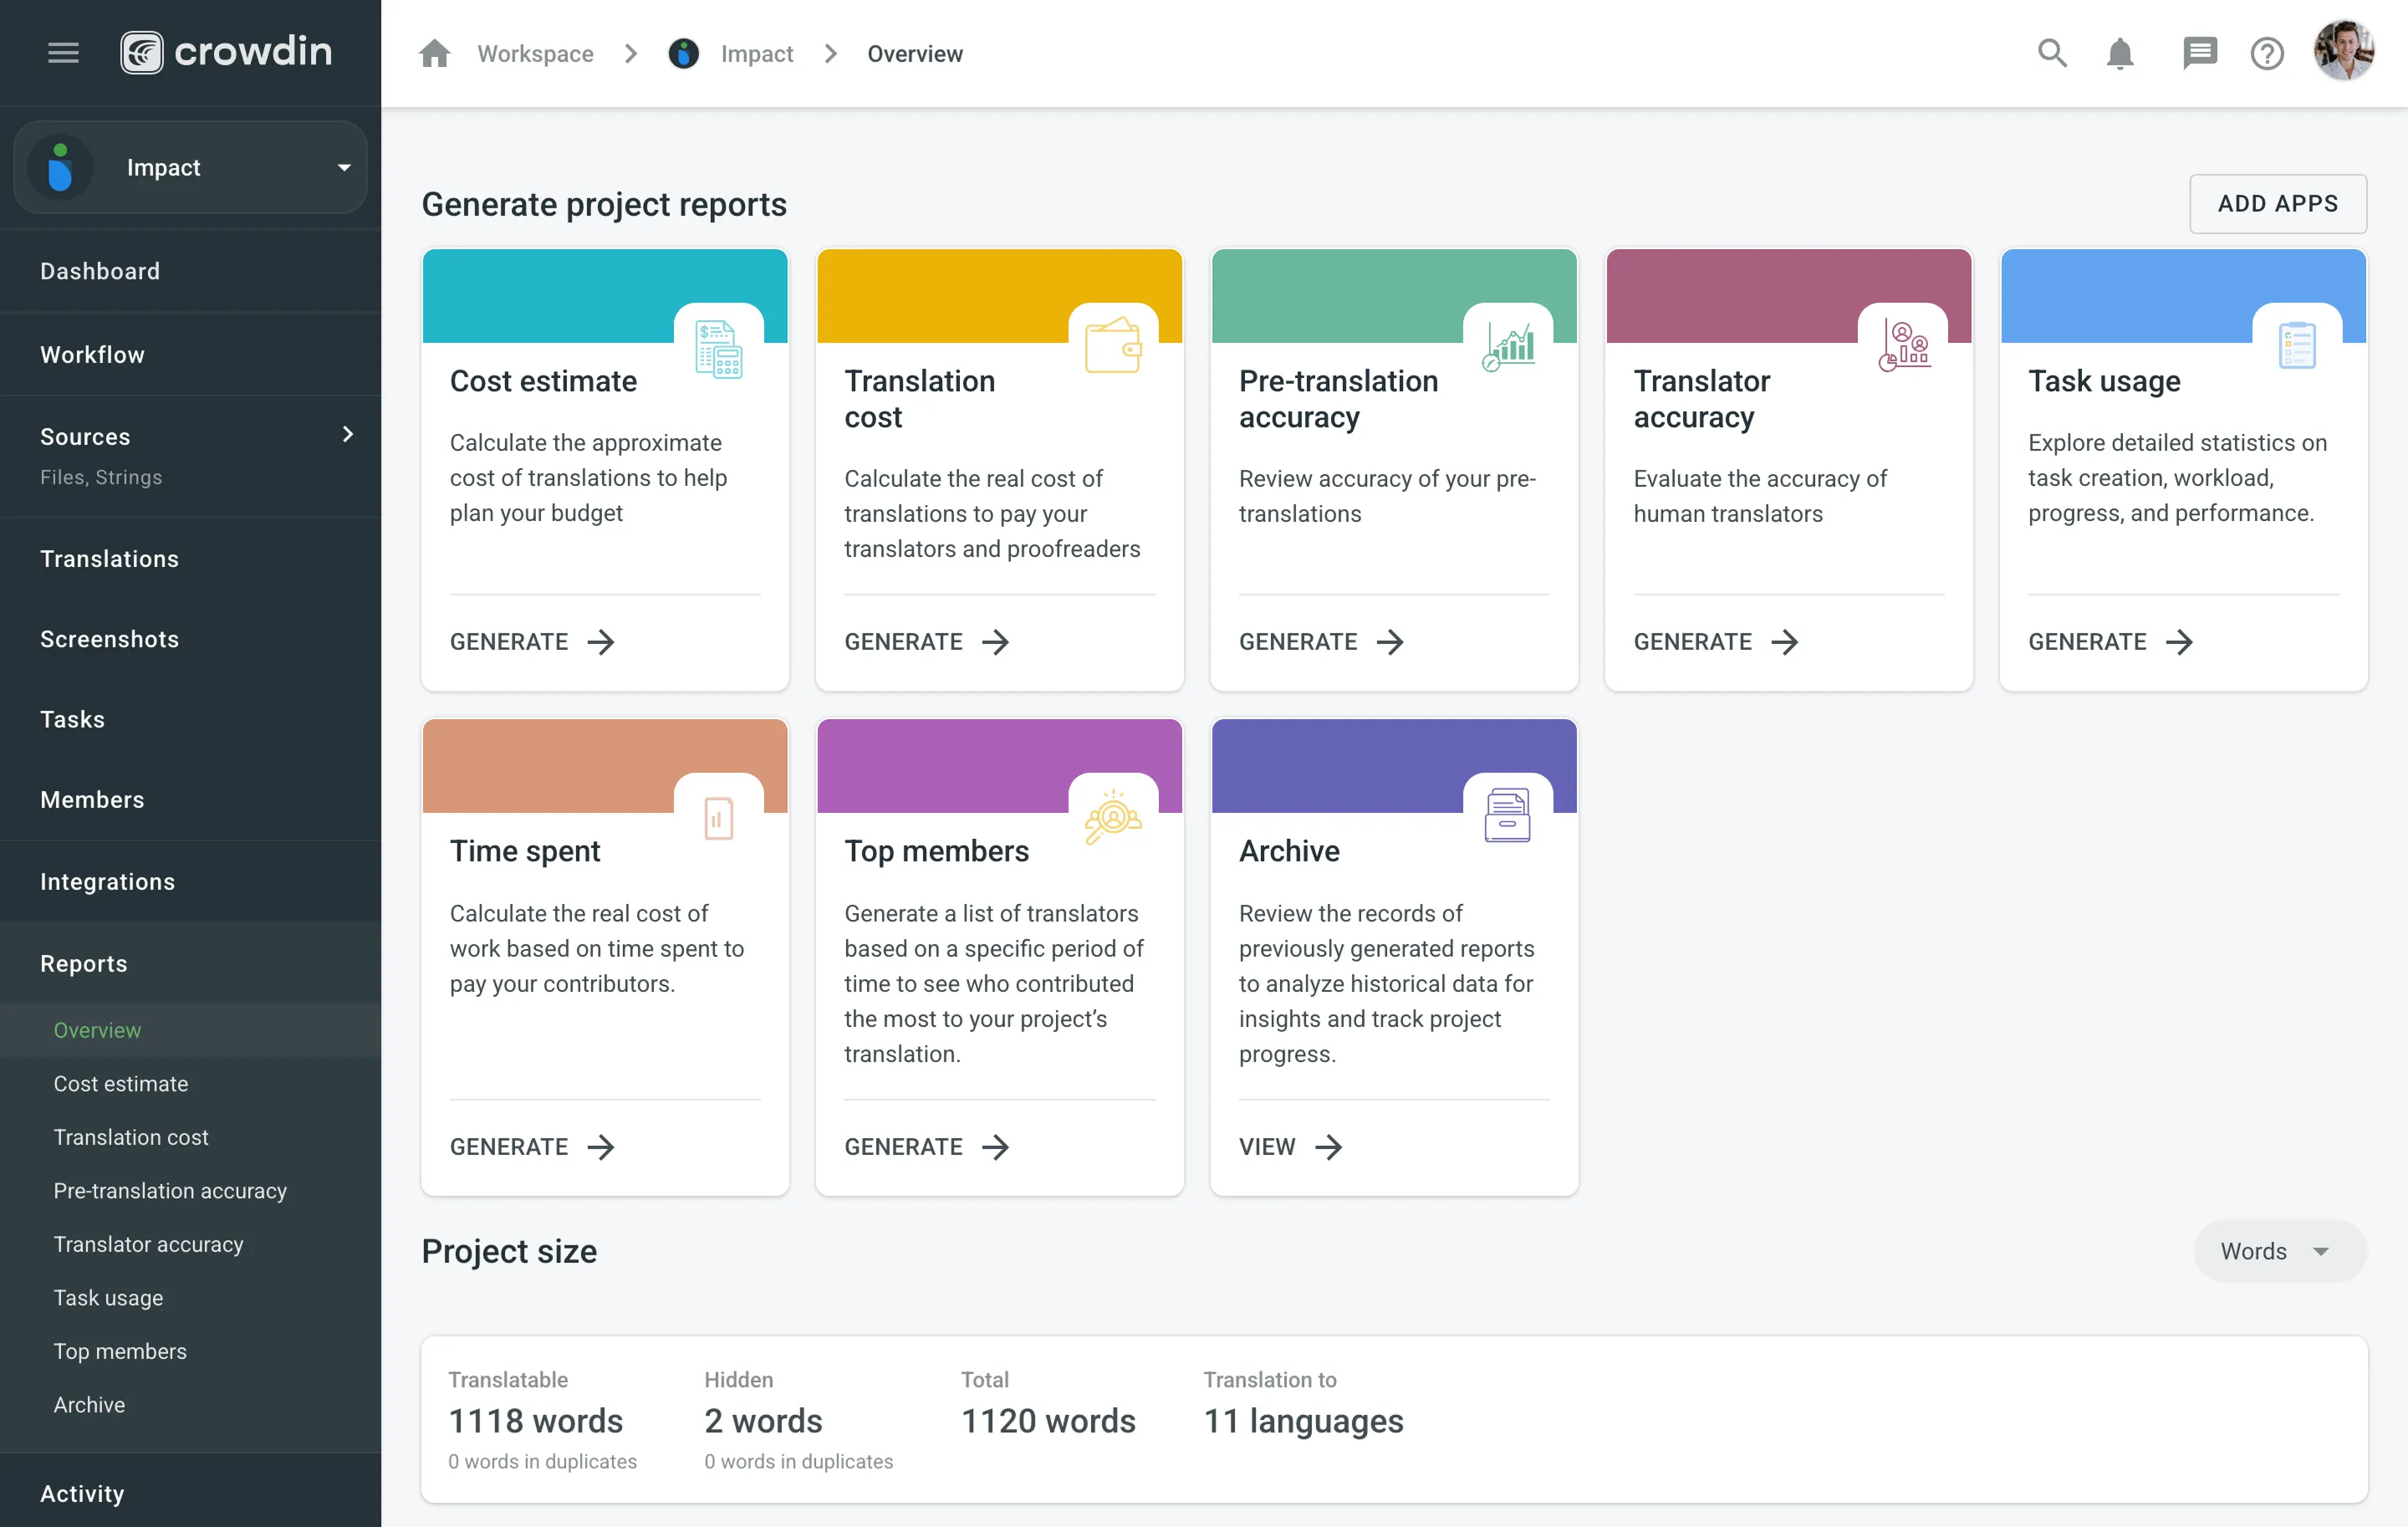
Use this section to get a comprehensive summary of your project’s health, monitor key activities, and track progress over selected time periods. In the upper-right corner, you can select a report unit (words, strings, characters, or characters with spaces) that will apply to all reports in this section. The comparisons shown in percentage are counted by comparing the chosen period of time to the same previous period of time (e.g., if you select a month, the current month is compared to the previous one).
To download reports for further analysis or record-keeping, click Export and select the preferred format (CSV, XLSX, or JSON).
In the reports that feature interactive graphs, you can hover over data points for more detailed information, such as daily or monthly totals for each category.
The Project size section displays the primary statistics for your project’s volume:
- Translatable: The total amount of text available for translation.
- Hidden: The total amount of text in hidden strings.
- Total: The total amount of text in the project (Translatable + Hidden).
- Translation to: The number of target languages in the project.
Below the main statistics, the Overview section contains the following reports:
This report tracks the overall translation and proofreading activity in the project. You can filter the data by Date Range, Language, and Member. The report is split into two main parts: Translation and Proofreading.
Each part displays the total work completed during the selected period with a percentage comparison to the previous period. You can expand the Breakdown by Language section in each part to view a table of the same metrics broken down by target language.
This section shows the volume of translated text, broken down by the following key metrics:
- Total (end of period)
- Human Translation
- Translation Memory
- Machine Translation
- AI
The Translation graph below the metrics displays multiple lines simultaneously for each translation type. By hovering over the data points, you can view daily or monthly totals for each category.
This section shows the volume of approved text and voting activity. The main metric displayed is Approved words.
The Proofreading graph visualizes the approval and voting activity over time, showing two distinct lines: Approved Words and Votes. By hovering over the data points, you can view the daily or monthly totals for both approved texts and votes cast.
Use this report to review the savings achieved in your project by using Translation Memory (TM), Machine Translation (MT), and Artificial Intelligence (AI).
You can filter the data by Date Range, Language, Member, and Files or Branches depending on the project type. By default, the Files/Branches filter is set to All files/branches. Clicking it opens a drop-down with a file tree where you can select specific items. The selection is saved automatically when you press Esc or click outside the drop-down. After that, the filter displays Currently selected: N files/branches. The report uses a Rates template to calculate savings. By default, it uses the Default Net Rate Scheme, but you can select a custom template to reflect specific agreements.
Using the Mode dropdown, you can switch between viewing the data as % (percentage) or currency.
The Translation Savings section displays the Total savings as a percentage or in currency for the selected period, along with a breakdown of savings from Translation Memory, Machine Translation, and AI.
The bar chart below visualizes these savings over time. Savings are calculated for each string only once, upon the first manual contribution (a new translation or an approval). This also includes approving a translation that originated from an Auto-translation (in this case, the saving is attributed to the date and method of the auto-translation).
If a string has a combination of TM and MT/AI suggestions available, the new contribution is counted towards the category with the highest potential saving value.
Hovering over the bars provides detailed information on savings per method on a daily or monthly basis. For a more granular view, you can also expand the Breakdown by languages section to see a table of savings for each specific language.
The Default Net Rate Scheme is the standard, built-in template used for calculation if no custom template is selected. This scheme defines savings based on a tiered “Net Rate” model, which reflects industry standards where not all matches provide equal value.
For example, a low-percentage fuzzy match (e.g., below 75%) is often reworked entirely by a translator. Therefore, this scheme considers such matches to provide 0% savings, even though a match was suggested.
The default scheme is divided into two categories, each with its own rates:
Saving Rates: TM
| Match Type | Net Rate | Saving |
|---|---|---|
| Perfect Match / Approval Without Changes | 5% | 95% |
| 100% / Approval Without Changes | 15% | 85% |
| 95-99% Fuzzy Match | 35% | 65% |
| 85-94% Fuzzy Match | 55% | 45% |
| 75-84% Fuzzy Match | 75% | 25% |
| < 75% Fuzzy Match | 100% | 0% |
Saving Rates: MT / AI
| Match Type | Net Rate | Saving |
|---|---|---|
| Approval Without Changes | 10% | 90% |
| 99-90% | 30% | 70% |
| 89-70% | 50% | 50% |
| 69-50% | 75% | 25% |
| < 50% | 100% | 0% |
Here are a few examples of how savings are calculated based on these default rates:
- TM Example: A 10-word string is translated using a 95-99% Fuzzy Match from your TM. According to the table, this match type has a saving of 65%. Therefore, the report will count 6.5 words (10 words * 65%) as saved.
- MT/AI Example (Approval): A 10-word string is auto-translated by an MT engine. A proofreader reviews and approves it without making any changes. This action falls into the Approval Without Changes category, which has a saving of 90%. The report will count 9 words (10 words * 90%) as saved.
- MT/AI Example (Manual Edit): A 10-word string has an MT suggestion. A translator edits the suggestion (or writes their own translation). The system compares the translator’s final saved translation to the original MT suggestion and finds they are 80% similar. This action falls into the 89-70% match category, which has a saving of 50%. The report will count 5 words (10 words * 50%) as saved.
- No Savings Example: A 10-word string has a < 75% Fuzzy Match. According to the TM table, this provides 0% saving. Even though there was a match, it’s not counted as a saving in the report, as it likely required a full re-translation.
This report tracks changes made to the source content over a selected time frame. You can filter the data by Date Range. The report displays the Total (end of period) volume of text, along with specific metrics for content that has been Added, Deleted, or Modified.
The bar graph helps you visualize when the most significant content updates occurred. By hovering over the bars, you can see the specific changes that occurred each day or month.
This report provides insights into the automated Quality Assurance (QA) checks, highlighting potential inconsistencies in translations. You can filter the data by Date Range and Language.
Key metrics include:
- New (Period): The number of new QA issues found within the selected period.
- Total (end of period): The total number of unresolved QA issues at the end of the selected period.
- Per 1000 words: The density of QA issues relative to the word count. This metric includes approved content and is only shown if the total word count is greater than 1000.
- Content with Issues: The volume of text that contains QA issues, including approved content.
- Content with Issues Rate: The percentage of text that has QA issues, including approved content.
Below the metrics, the report also features several additional components:
- Breakdown by Language: An expandable section that shows a table of the key metrics broken down by each target language.
- Issues Trend: A line graph that monitors the total number of QA issues over time. You can hover over data points to see the total number of issues for a specific day.
- Issues by languages: A heatmap-style table that visualizes the distribution of QA issue types (e.g., Spelling mistakes, Consistent terminology) across all target languages. You can hover over a cell to see the precise number of issues for that specific language and type.
This report tracks issues manually created by project members to report problems or ask questions. You can filter the data by Date Range and Issue Type. The main metrics show the Total, Created, and Resolved issues, each with a comparison to the previous period.
This report consists of the following components:
- Issues by Type: A table showing the total, created, and resolved counts for each issue category (e.g., General question, Current translation is wrong).
- Incorrect Translations by Language: A table focusing on the Current translation is wrong issue type, breaking down the numbers by language.
- Cumulative Created vs Resolved Issues: A line graph that visualizes the cumulative number of created versus resolved issues.
- Average Resolution Time by Issue Type: A bar chart showing the average time in days it takes to resolve each type of issue.
- Top Reporters & Resolvers: A leaderboard of members who have reported and resolved the most issues, with sortable columns for Name, Issues Reported, and Issues Resolved.
This report helps you monitor the activity and changes among your project members, which can help managers assess the level of engagement. You can filter the data by Date Range. The report displays key metrics about your member base for the selected period, including:
- Total (end of period): The total number of members in the project.
- Active: The number of members who were active during the period.
- New: The number of newly joined members.
- Pending (end of period): The number of users with pending join requests (including both incoming and outgoing invitations).
A graph below the metrics displays the trend of the total member count over time.
Use this report to plan your budget and count the approximate cost of translations. Set the translation and approval rates to see the cost for untranslated and not approved strings in the project.
You can generate a Cost Estimate report based on the following filter parameters:
- Tasks: Not selected, All tasks, or multiple specific tasks.
- Language: All or specific target language.
- Strings Added: All time, Today, Yesterday, Last 7 days, Last 30 days, Last month, or Custom range.
- Files: All or specific files.
- Workflow step (Specific to projects with a workflow): All or a specific workflow step.
- Labels (Specific to projects with labels): Not selected, Strings with selected labels, or Strings without selected labels.
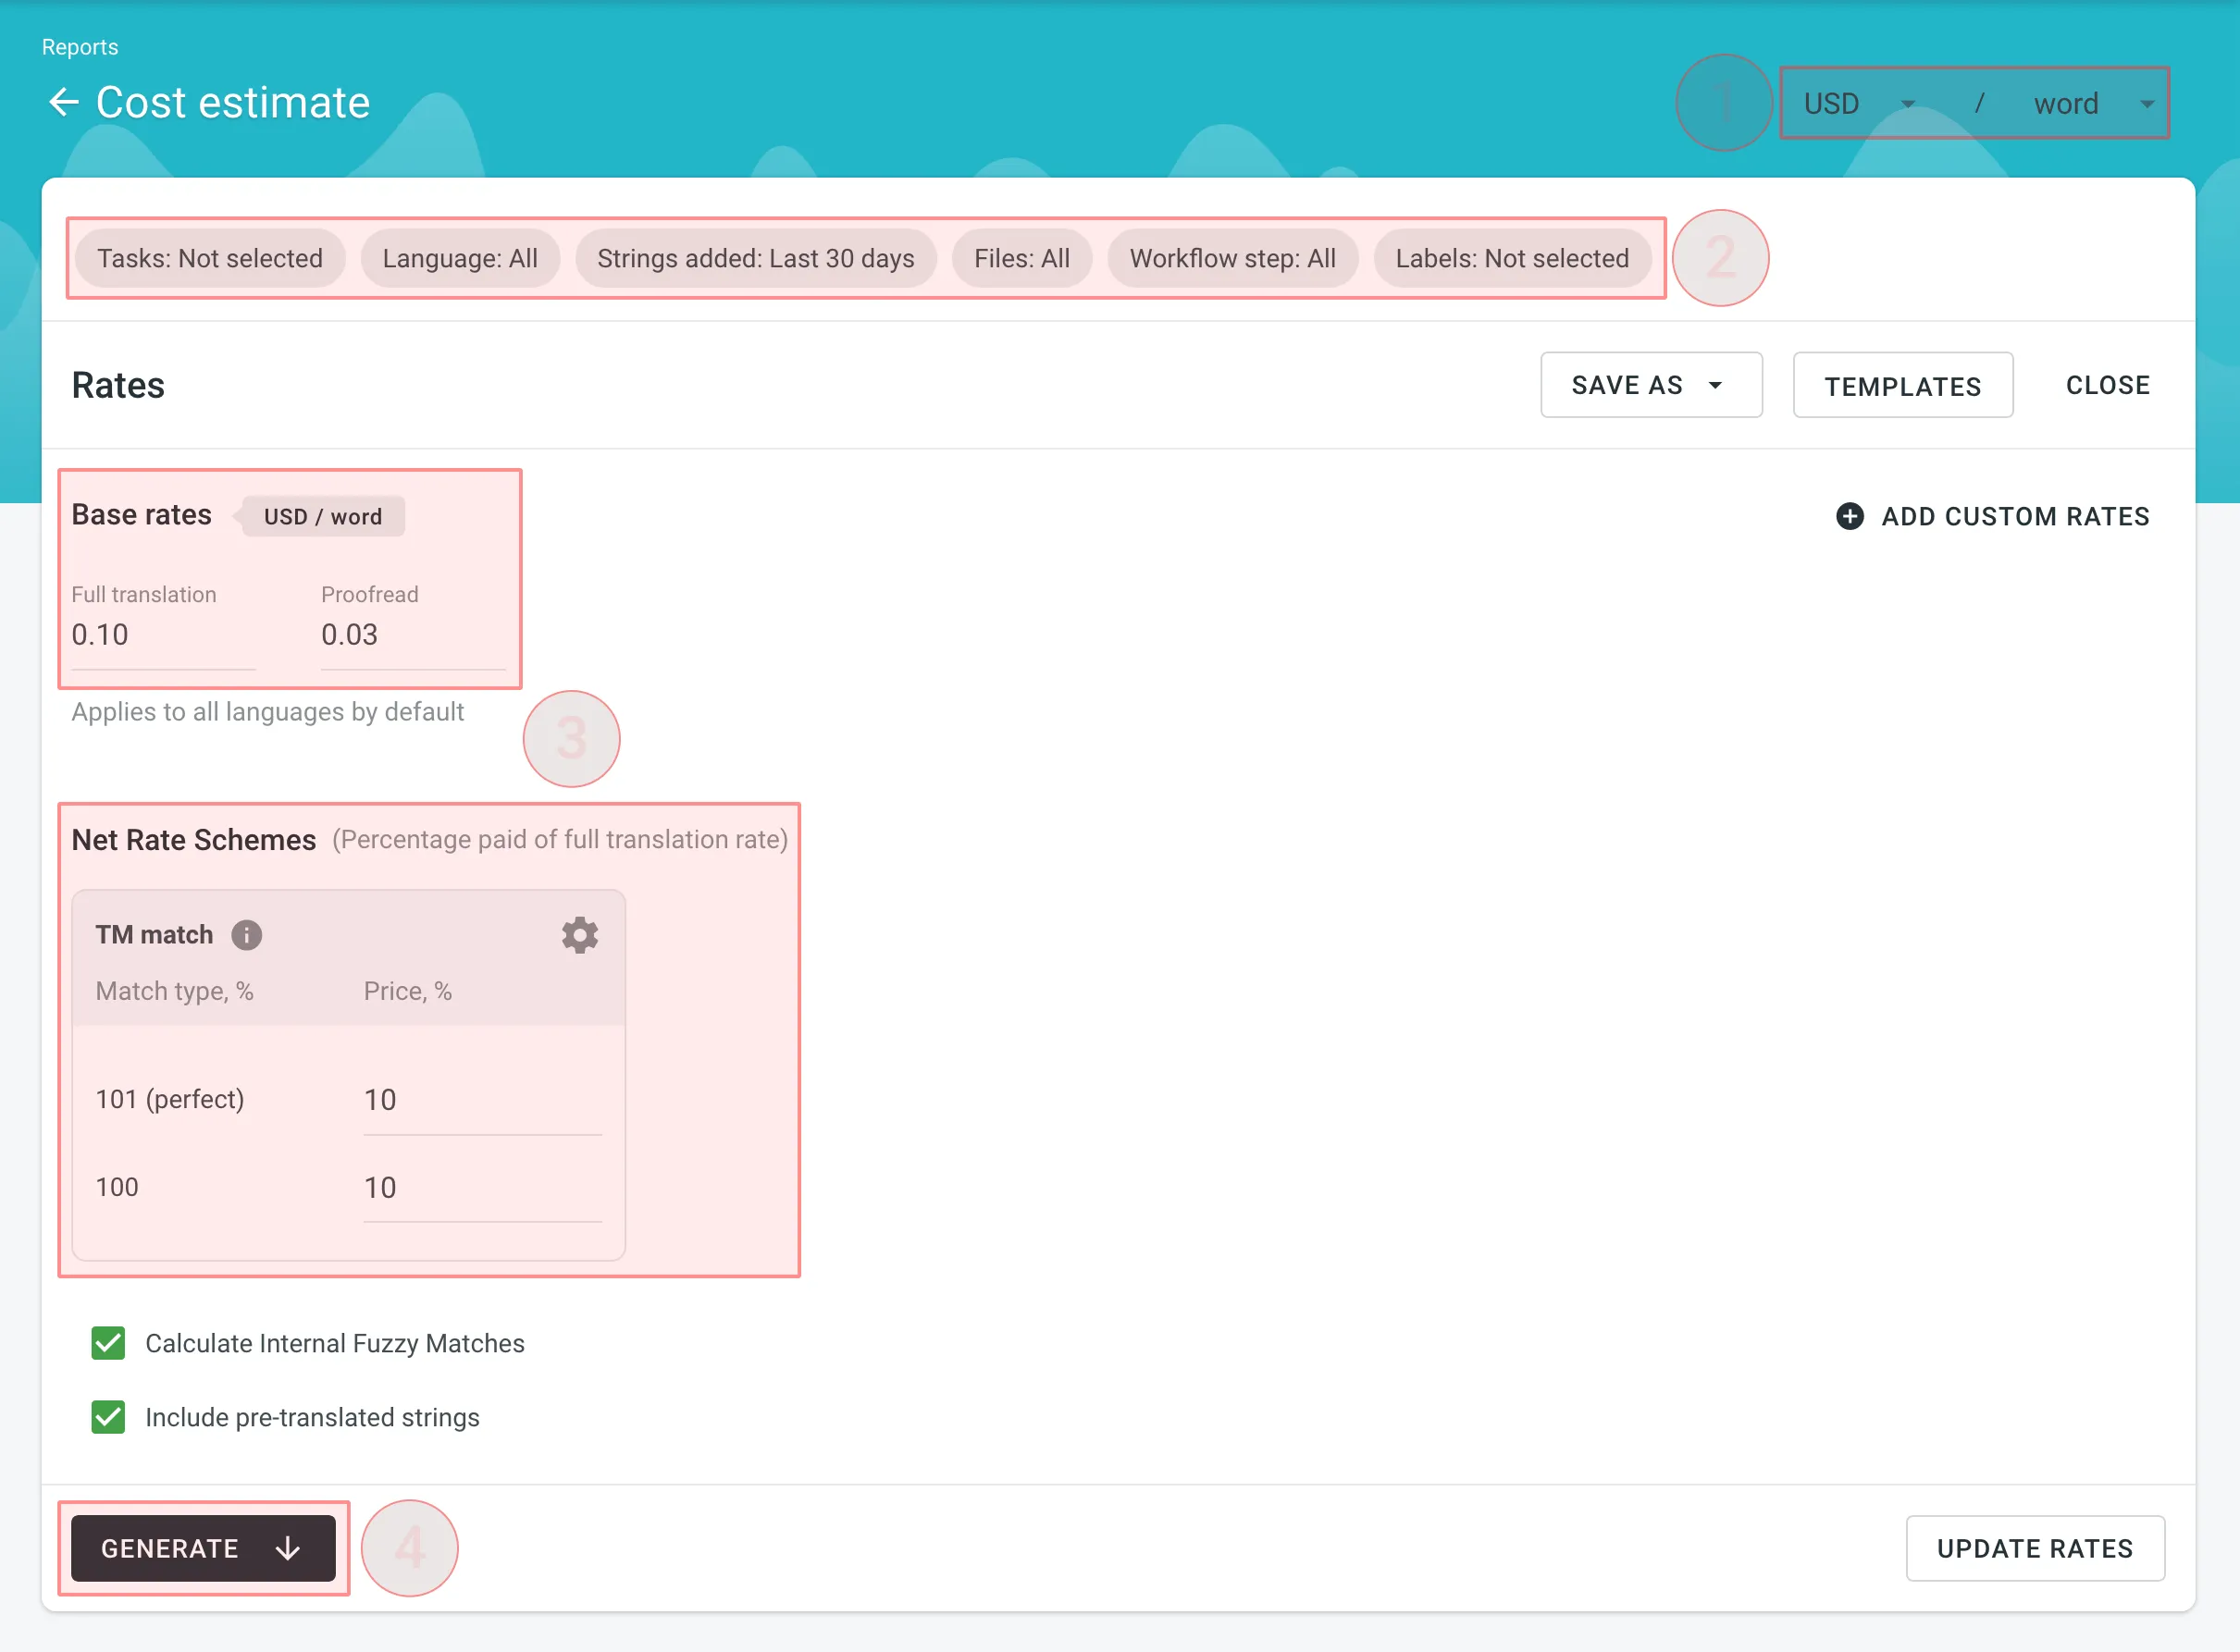
To generate the Cost Estimate report, follow these steps:
- Select the preferred currency and the report unit (word, string, character, or characters (including spaces)).
- Use the available filter parameters to specify the report data you’re interested in.
- Set your rates for translations and approvals.
- Click Generate.
After you click Generate, the Cost Estimate report is added to a queue and processed in the background. This ensures that multiple reports generated by different users or with different filters don’t override one another. Each report is generated separately and appears in the Reports > Archive section once completed (if the Save to archive option was selected).
When a report is added to the queue, a notification appears confirming that the report generation has been queued, with quick access to view the queue or close the message.
While the report is being generated, a pop-up in the lower-right corner of the screen shows the queue status. The status updates automatically as the report progresses:
- Pending – the report is waiting in the queue and has not started processing yet.
- In progress – the report generation has started. A progress bar shows the current percentage.
- Completed – the report has been generated successfully and can be accessed via the Archive.
- Failed – an error occurred during report generation.
Each report runs independently, so you can safely generate multiple Cost Estimate reports with different filters without affecting those that might have been started earlier and are still in progress.
You can set the prices for Base rates (full translation, proofread) and configure Net Rate Schemes (percentage of the full translation rate paid for translation using TM suggestions).
In the Base Rates section, you can set rates for the following types of work:
- Full translation – for each translation made by a person.
- Proofread – for each approved translation.
In the Net Rate Schemes section, in addition to the base rates, you can set the percentage of the full translation rate to be paid for translations made using TM suggestions of various TM Match types. By default, you can configure the percentage of the full translation rate for the following TM Match types:
- 101 (perfect) – for translations made using Perfect match TM suggestions (source strings are identical to TM suggestion by text and context).
- 100 – for translations made using 100% match TM suggestions (source strings are identical to TM suggestion only by text).
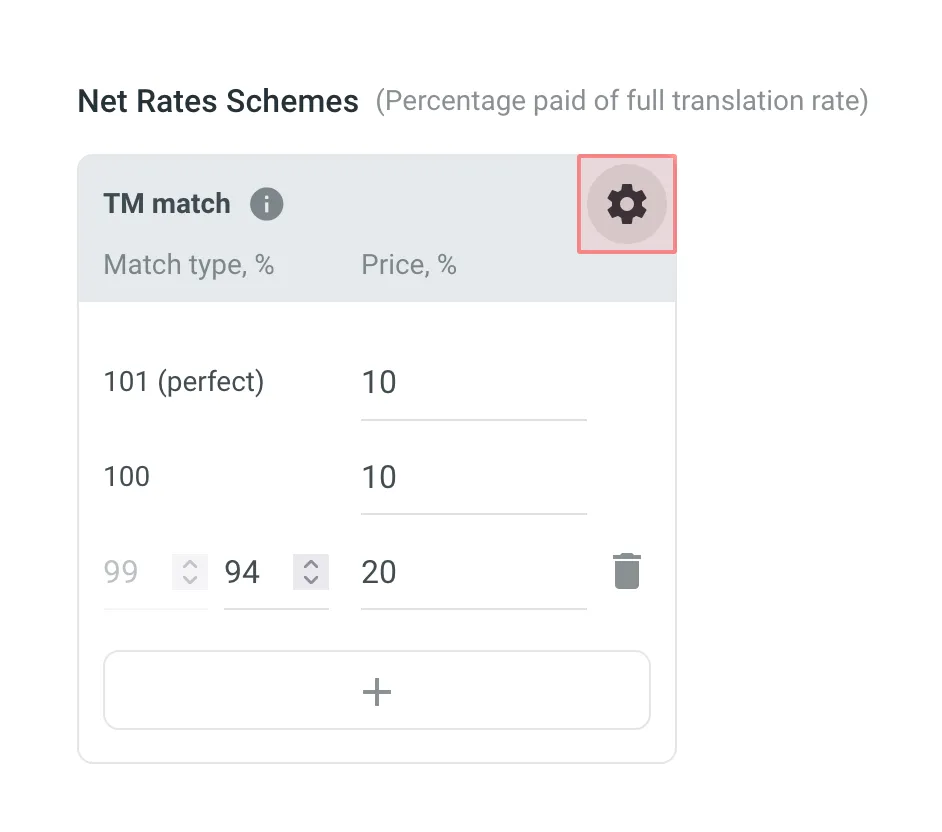
You can also add your own TM match types, specifying the preferred percentage of text similarity and the percentage of the full translation rate to be paid for such a translation.
To add your own TM match types, follow these steps:
- Click in the Net Rate Schemes section.
- Click on the appeared button.
- Specify the TM match range and the percentage of the full translation rate.
- Click to save the settings.
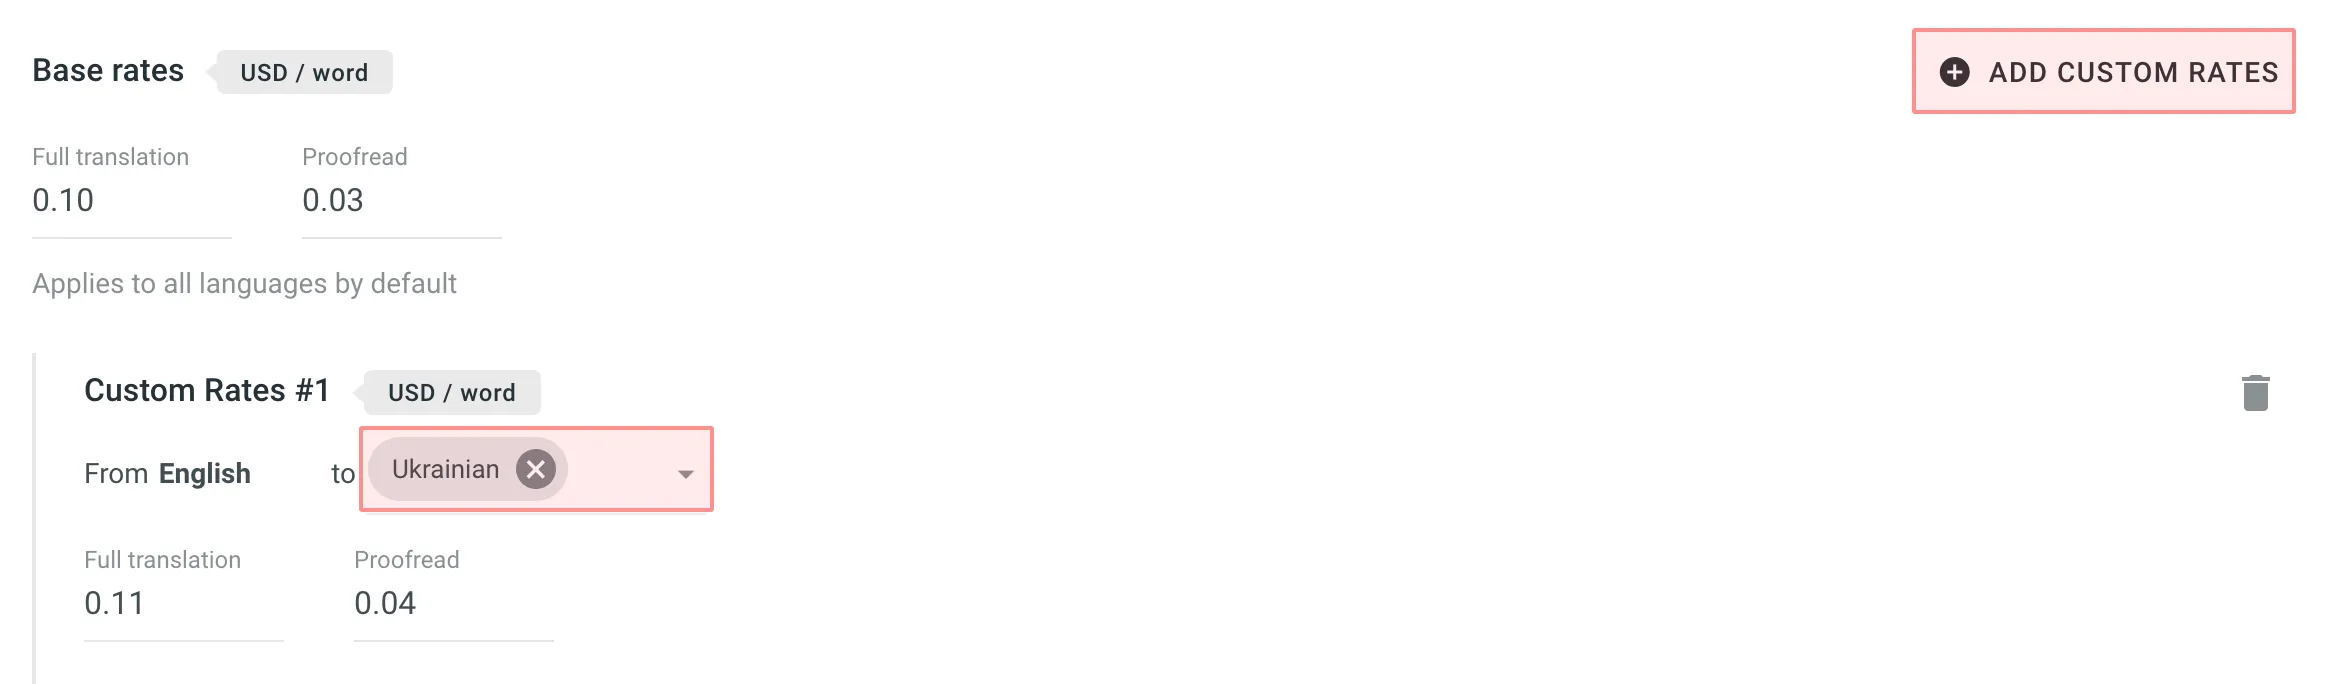
In addition to base rates that are applied to all languages by default, you can add custom rates for specific languages. To add custom rates, click Add custom rates.
To select the language or languages for custom rates, click the drop-down menu, and select the ones you need. You can create as many custom rates as you need.
If you plan to work with multiple rate configurations, save them as templates by clicking Save as > New rates template, then specify the template name and click Save.
When saving a new template you can choose the template visibility using the following options:
-
Share with all project members – makes the template visible to all translators within the project. Regardless of the number of translators or their different rates, they all will have access to the template. It can include both general rates and custom rates for specific languages and translators, along with a net rate scheme. This transparency promotes clarity in pricing, allowing translators to review rates, generate reports on their translations, and calculate cost estimates. The key benefit is that translators understand the net rate scheme and can apply their base rate, even if it’s not included in the template.
-
Share with managers within the organization – makes the template global, visible only to managers across all projects of the organization. This option streamlines rate consistency across various projects.
If neither of the options is selected, the template remains visible only to managers within the current project, limiting access to a select group of project members. These options provide flexibility in controlling who can view and use the rate template to accommodate different organizational preferences.
Saved templates allow you to quickly switch between different configurations for report generation.
Click Templates to view and manage your saved rate templates.
Select Include auto-translated strings if you want to include auto-translated strings in a Cost Estimate report. By default, this option is selected.
For example, you have an untranslated string Validate your username in your project. You generate a Cost Estimate report with the Include auto-translated strings option selected. This string will be included in the Cost Estimate. Then you auto-translate this string via TM or MT engine and once again generate a Cost Estimate report with the Include auto-translated strings option selected. This time, the auto-translated string Validate your username won’t be included in the Cost Estimate report.
On the other hand, with the Include auto-translated strings option cleared, the string Validate your username will be included in the Cost Estimate report both times, when untranslated and when auto-translated via TM or MT engine.
Internal Fuzzy Matches are partial (fuzzy) TM matches found among untranslated strings in your project that can potentially be added to the Translation Memory. For example, if the first string in a file is Validate your username and the last one is Validate your username again, there is an internal fuzzy match.
To include fuzzy (99% and less) internal matches, as well as perfect (101%) and 100% matches, in your Cost Estimate report and get a more comprehensive prediction of how many strings can be added to the TM if translated in sequence, select Calculate Internal Fuzzy Matches. Note that these calculations are approximate because the actual translation order may differ.
If you clear Calculate Internal Fuzzy Matches, the Cost Estimate report will only show perfect (101%) and 100% internal matches (repetitions), and will not include any fuzzy matches.
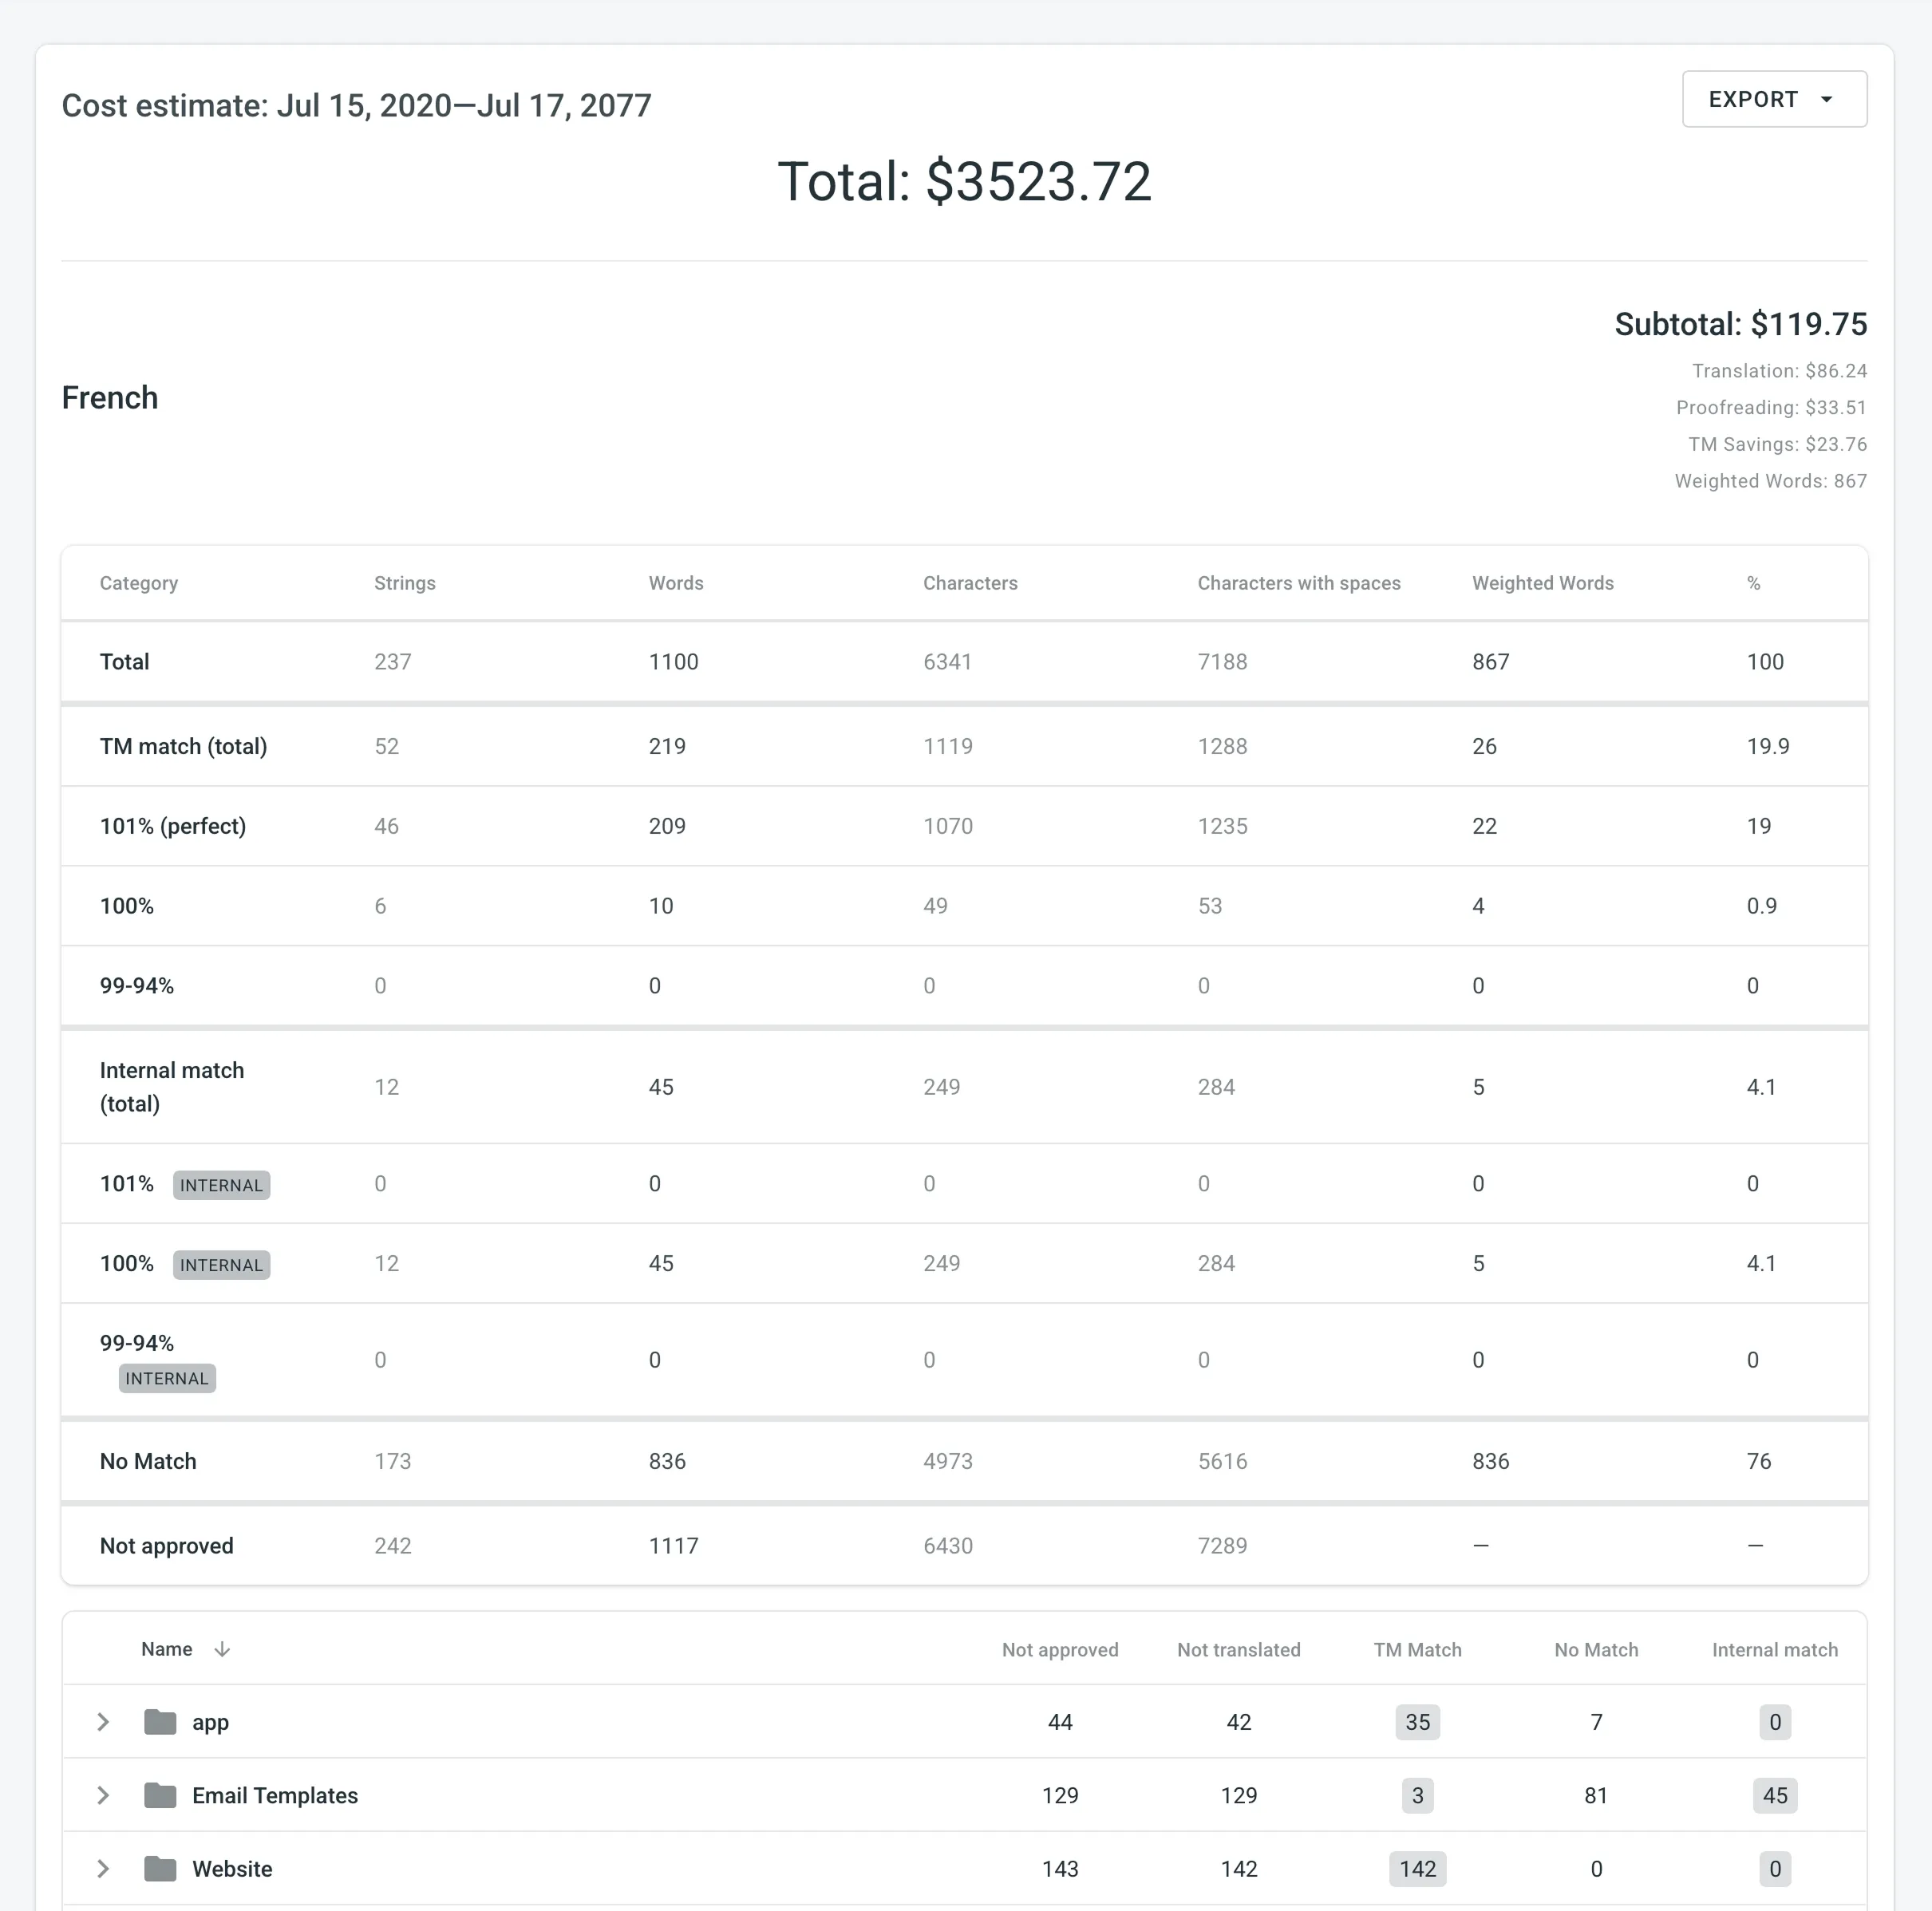
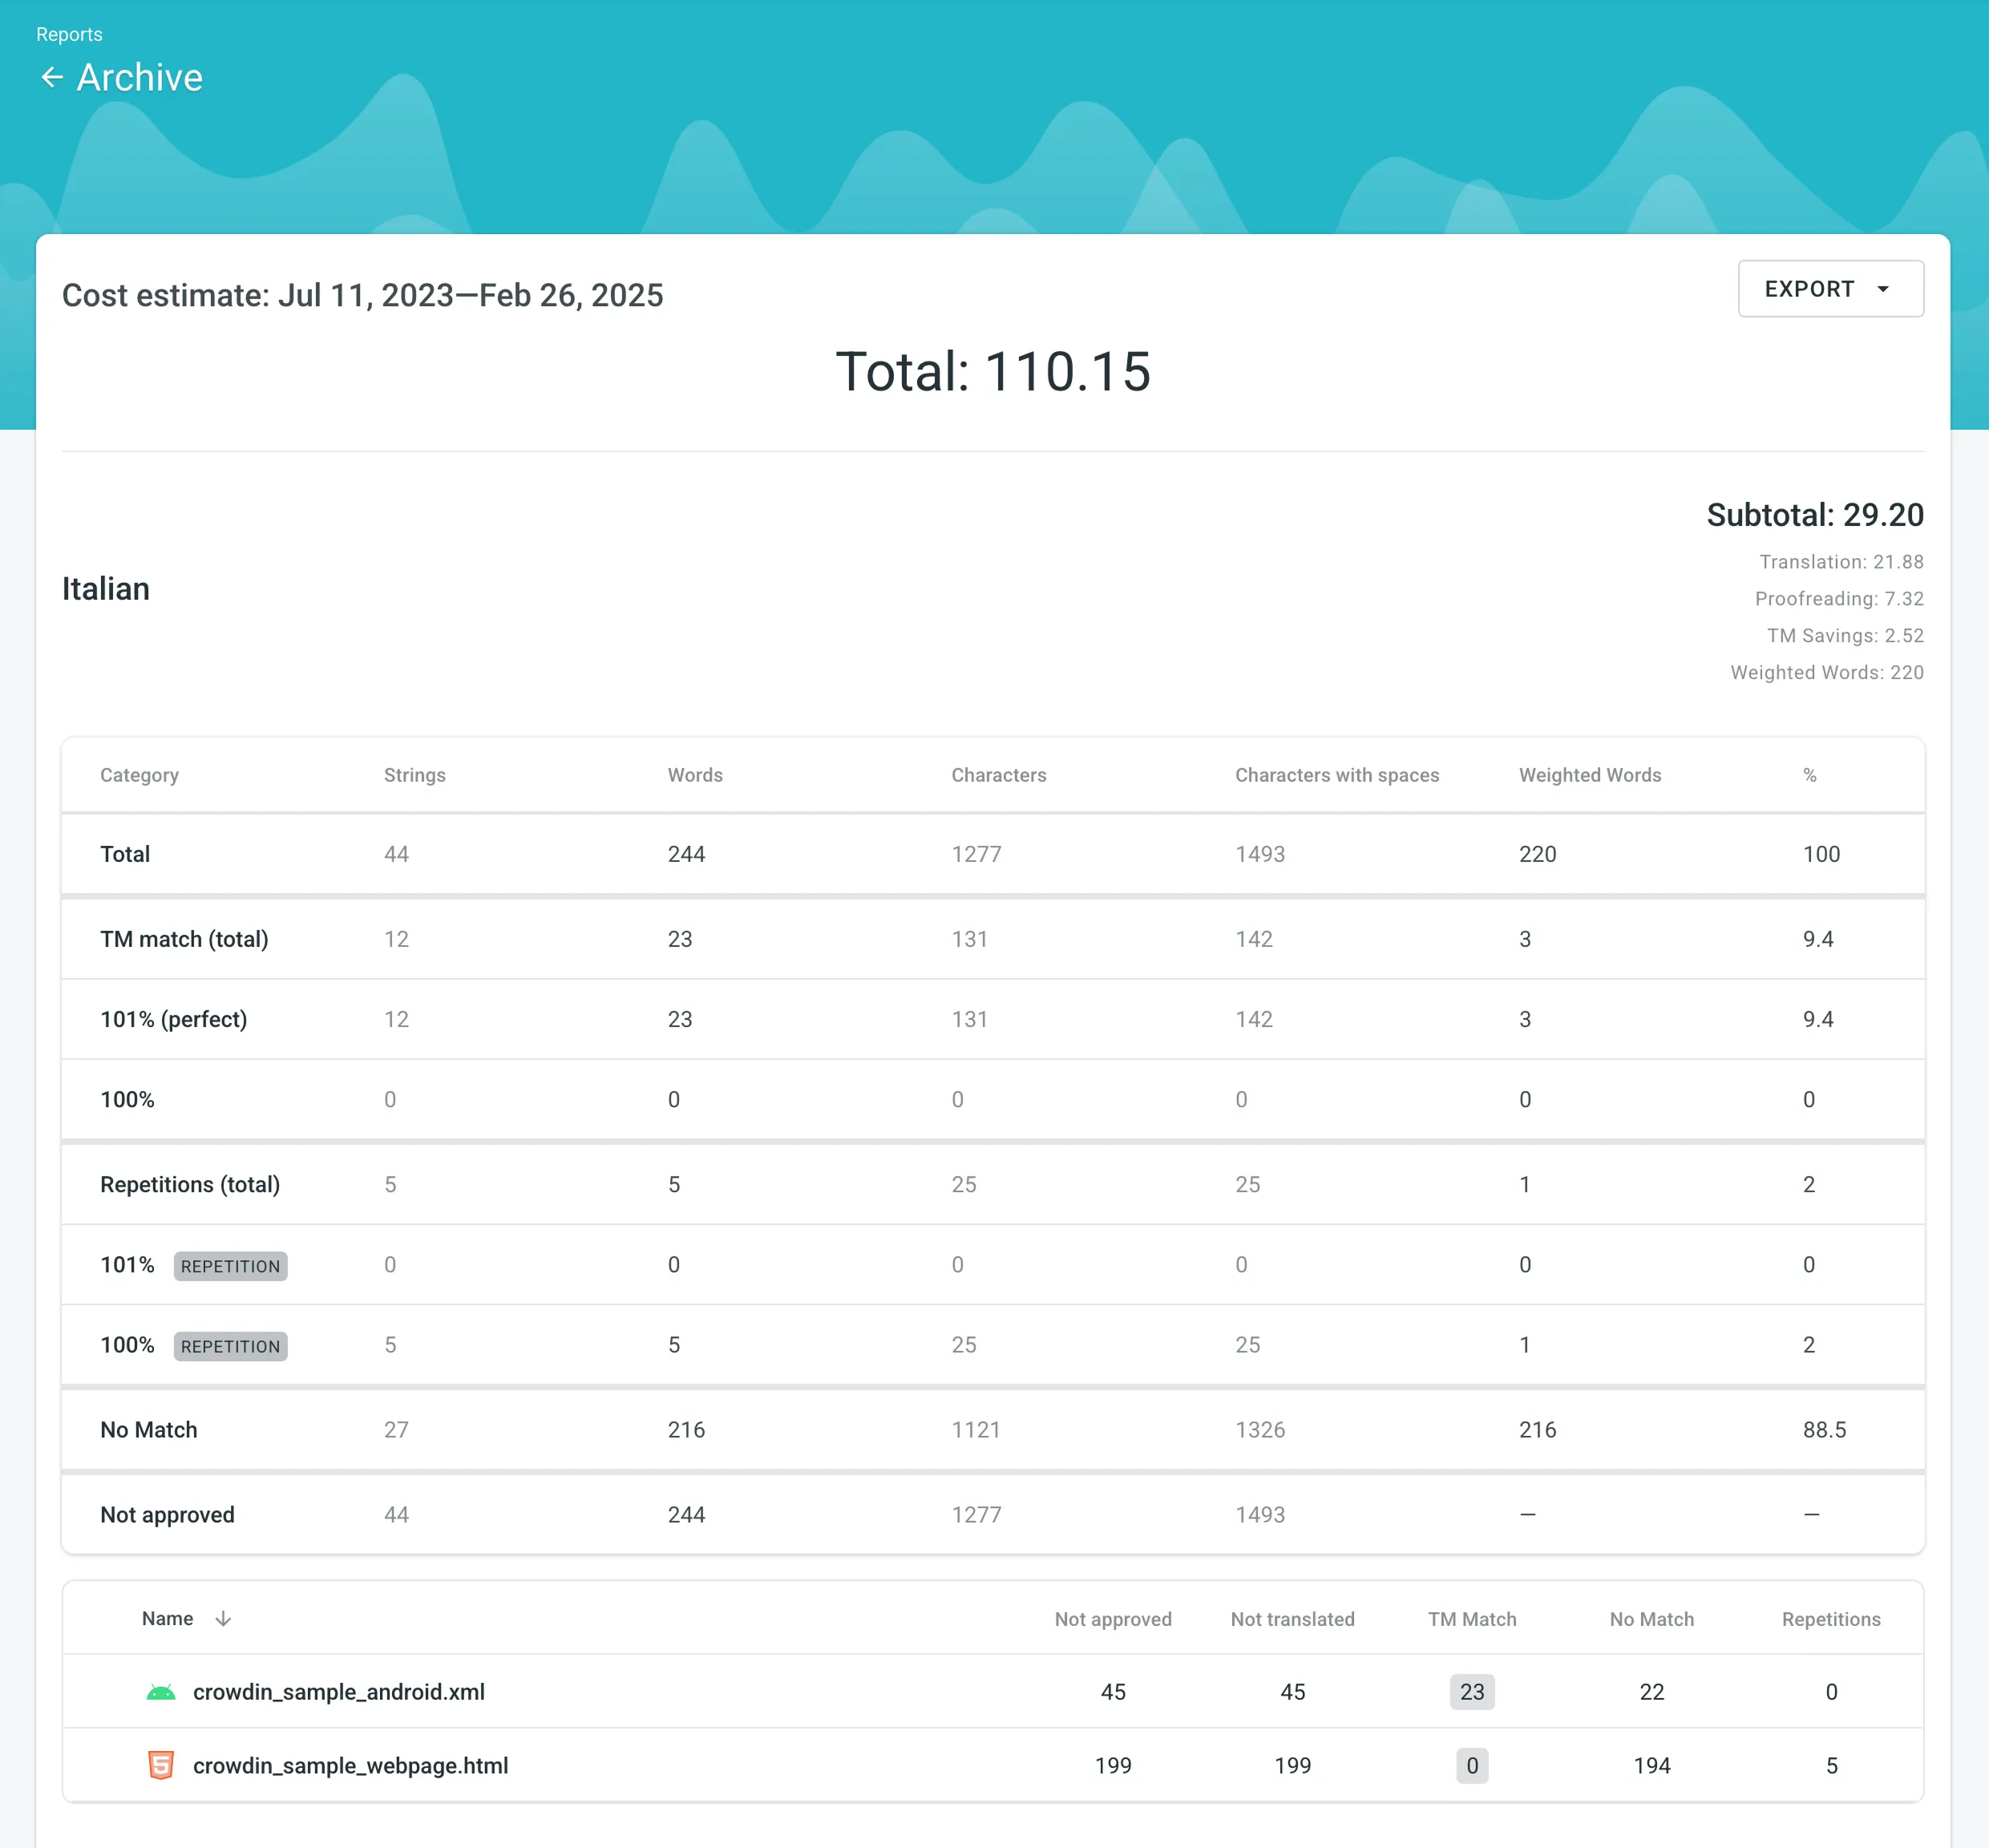
When the Cost Estimate report is generated, it displays the following details:
- Total - General cost estimate for all languages (including translation, proofreading, and any TM savings).
- Subtotals - Cost estimate for each target language:
- Translation – Cost for strings requiring new or updated translations (no high–percentage match leverage).
- Proofreading – Cost for reviewing translations.
- TM Savings – Savings from existing translations (in TM or within the project).
- Weighted Words / Strings / Characters / Characters with Spaces – Final word count for cost calculations after applying TM/internal match discounts.
Each row in the main table represents a match category or status:
-
Total – Summarizes all strings, words, and characters, as well as the weighted units after match discounts and percentage of the total.
-
TM Match (total) – Untranslated strings matching entries in Translation Memory, often split into:
- 101% (perfect) – Exact text and context match.
- 100% – Exact text match, but context differs.
-
Repetitions (total) or Internal Match (total) – Untranslated strings matching other strings within the project. Displaying depends on whether Calculate Internal Fuzzy Matches is enabled. Subcategories (e.g., 101%, 100%, and fuzzy) depend on your Net Rate Schemes.
If an untranslated string has both a 101% TM match and a 100% internal match, it counts toward TM match.
-
No Match – Strings with no TM or internal matches, requiring translation from scratch.
-
Not Approved – Translated strings that still awaiting approval.
-
Not Translated – Completely untranslated strings requiring full translation.
- Strings / Words / Characters / Characters with Spaces – Basic volume metrics.
- Weighted Words / Strings / Characters / Characters with Spaces – Shows the adjusted metric after factoring in repetitions and fuzzy matches, reflecting the actual translation effort.
- % – Share of weighted units in each category.
After the main table, each language subtotal also includes a table showing data for each folder or file, indicating how many strings are Not Approved, Not Translated, match the TM, match Internal, or have No Match. This helps identify where to focus your translation efforts and budget.
To download the Cost Estimate report, click Export and select the preferred format (CSV, XLSX, or JSON) for further analysis or record-keeping.
Use this report to calculate the actual translation and proofreading costs based on the volume of units completed by contributors (e.g., words).
You can generate a Translation Cost report based on the following filter parameters:
- Tasks: Not selected, All Tasks, or multiple specific tasks.
- Group by: Member or language.
- Time period: All time, Today, Yesterday, Last 7 days, Last 30 days, Last month, or Custom range.
- Workflow step (Specific to projects with a workflow): All or specific workflow step.
- Files: All files (including deleted files and strings) or Selected files (including deleted strings).
- Branches (Specific to string-based projects): All branches or Selected branches.
- Language: All or specific target language.
- Users: All or specific users.
- Labels (Specific to projects with labels): Not selected, Strings with selected labels, or Strings without selected labels.
To generate the Translation Cost report, follow these steps:
- Select the preferred currency and the report unit (word, string, character, or characters (including spaces)).
- Use the available filter parameters to specify the report data you’re interested in.
- Set your rates for translations and approvals.
- (Optional) Configure the Advanced settings.
- (Optional) Clear Save to archive if you don’t want to save the report to the Archive.
- Click Generate.
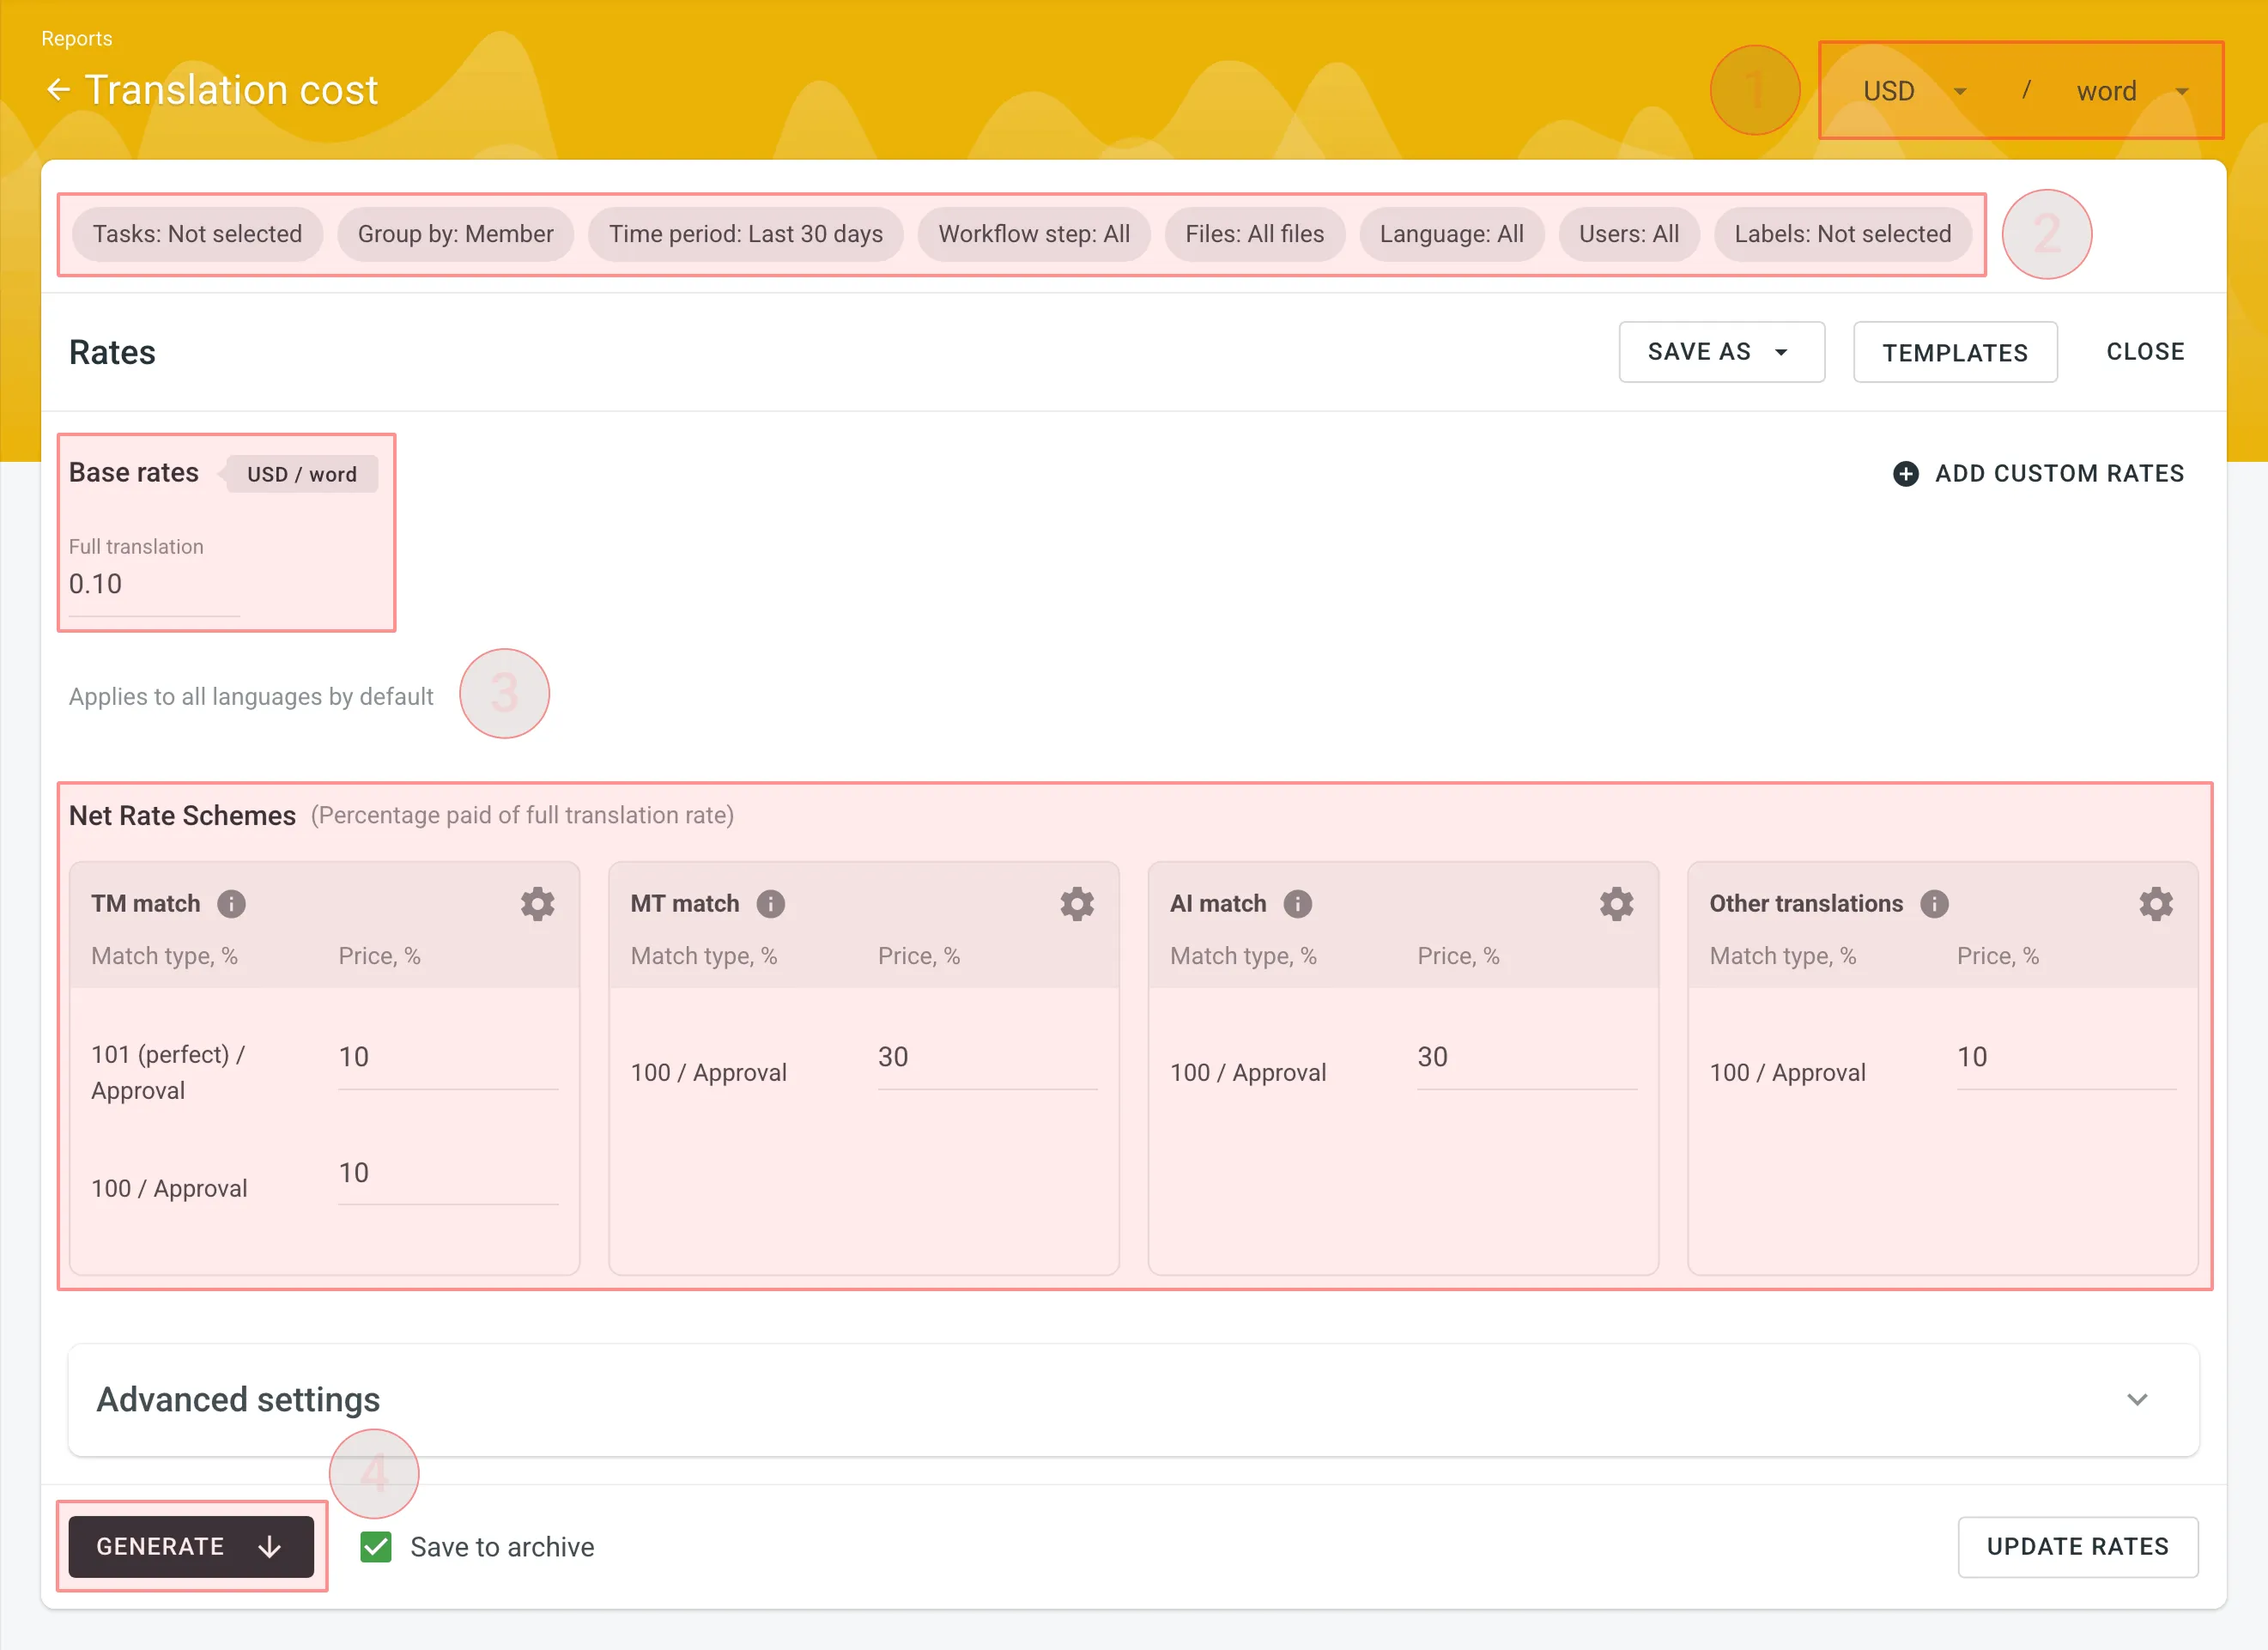
You can set the prices for Base rates and configure Net Rate Schemes (percentage of the full translation rate paid for translation and proofreading based on TM match, MT match, AI match, and Other translations).
In the Base Rates section, you can set the rate for the following type of work:
- Full translation – for each translation made by a person.
Click Advanced settings to expand a section with additional configuration options for your report. All of these options are enabled by default and are recommended:
- Use category-based approval rates: Calculates proofreading costs by treating approvals as submitting an identical translation at the 100% match rate of the corresponding Net Rate Scheme category (TM, MT, AI, or Other). When disabled, all approvals use the flat base proofread rate.
- Exclude approvals for edited translations: Excludes approvals when the same user has made translations for the string. This helps ensure that your cost reporting is more accurate by avoiding the duplication of approval costs.
- Use Specific Categories for Auto-translations: Assigns auto-translation matches to categories within the Net Rate Scheme according to their source (e.g., MT, AI), instead of the default Other translations category. This is useful because post-editing translations from MT engines or AI usually requires a different level of effort than post-editing translations from human translators, leading to a more precise measure of costs.
In the Net Rate Schemes section, you can set the percentage of the full translation rate to be paid for translations and their approvals based on various Match types.
Because the Use category-based approval rates option is enabled by default, the cost of proofreading depends on the translation’s origin category (TM, MT, AI, or Other).
Regardless of the translation’s original match percentage, its approval is always calculated at the maximum match rate for that category.
Here is how it works in practice:
- Partial matches: If a translation was an 85% MT match, its approval is charged at the 100 / Approval rate under the MT match category.
- Translations from scratch (No match): If a translation was made without any suggestions, its approval is charged at the 100 / Approval rate under the Other translations category.
By default, you can configure the percentage of the full translation rate for the following categories:
TM match:
- 101 (perfect) / Approval – for translations made using Perfect match TM suggestions (source strings are identical to the TM suggestion by text and context), and for their approvals.
- 100 / Approval – for translations made using 100% match TM suggestions (source strings are identical to the TM suggestion only by text), and for approvals of all TM matches of 100% or lower.
MT match:
- 100 / Approval – for translations made using 100% match MT suggestions (the saved translation matches the MT suggestion exactly), and for all approvals within the MT category.
AI match:
- 100 / Approval – for translations made using 100% match AI suggestions (the saved translation matches the AI suggestion exactly), and for all approvals within the AI category.
Other translations:
- 100 / Approval – for translations made using existing translations from other users (the saved translation matches the existing translation exactly), and for approvals of translations made from scratch (No match) or using existing translations.
If multiple scheme categories can be applied to a translation (e.g., a string has a combination of TM, MT, or AI suggestions, and existing translations from other users), the new translation is calculated at the lowest Net Rate Scheme value. For example, if a string has a 101% (perfect) TM match suggestion (10% of the full translation rate) and a 100% MT match suggestion (5% of the full translation rate), the new translation added to this string will be calculated at 5% of the full translation rate.
You can also add custom match types for the TM, MT, AI, and Other translations categories, specifying the preferred percentage of text similarity and the percentage of the full translation rate to be paid for such a translation.
To add your own match types, follow these steps:
- Click in the header of the specific category section.
- Click at the bottom of the section.
- Specify the match range and the percentage of the full translation rate.
- Click again to save the settings.
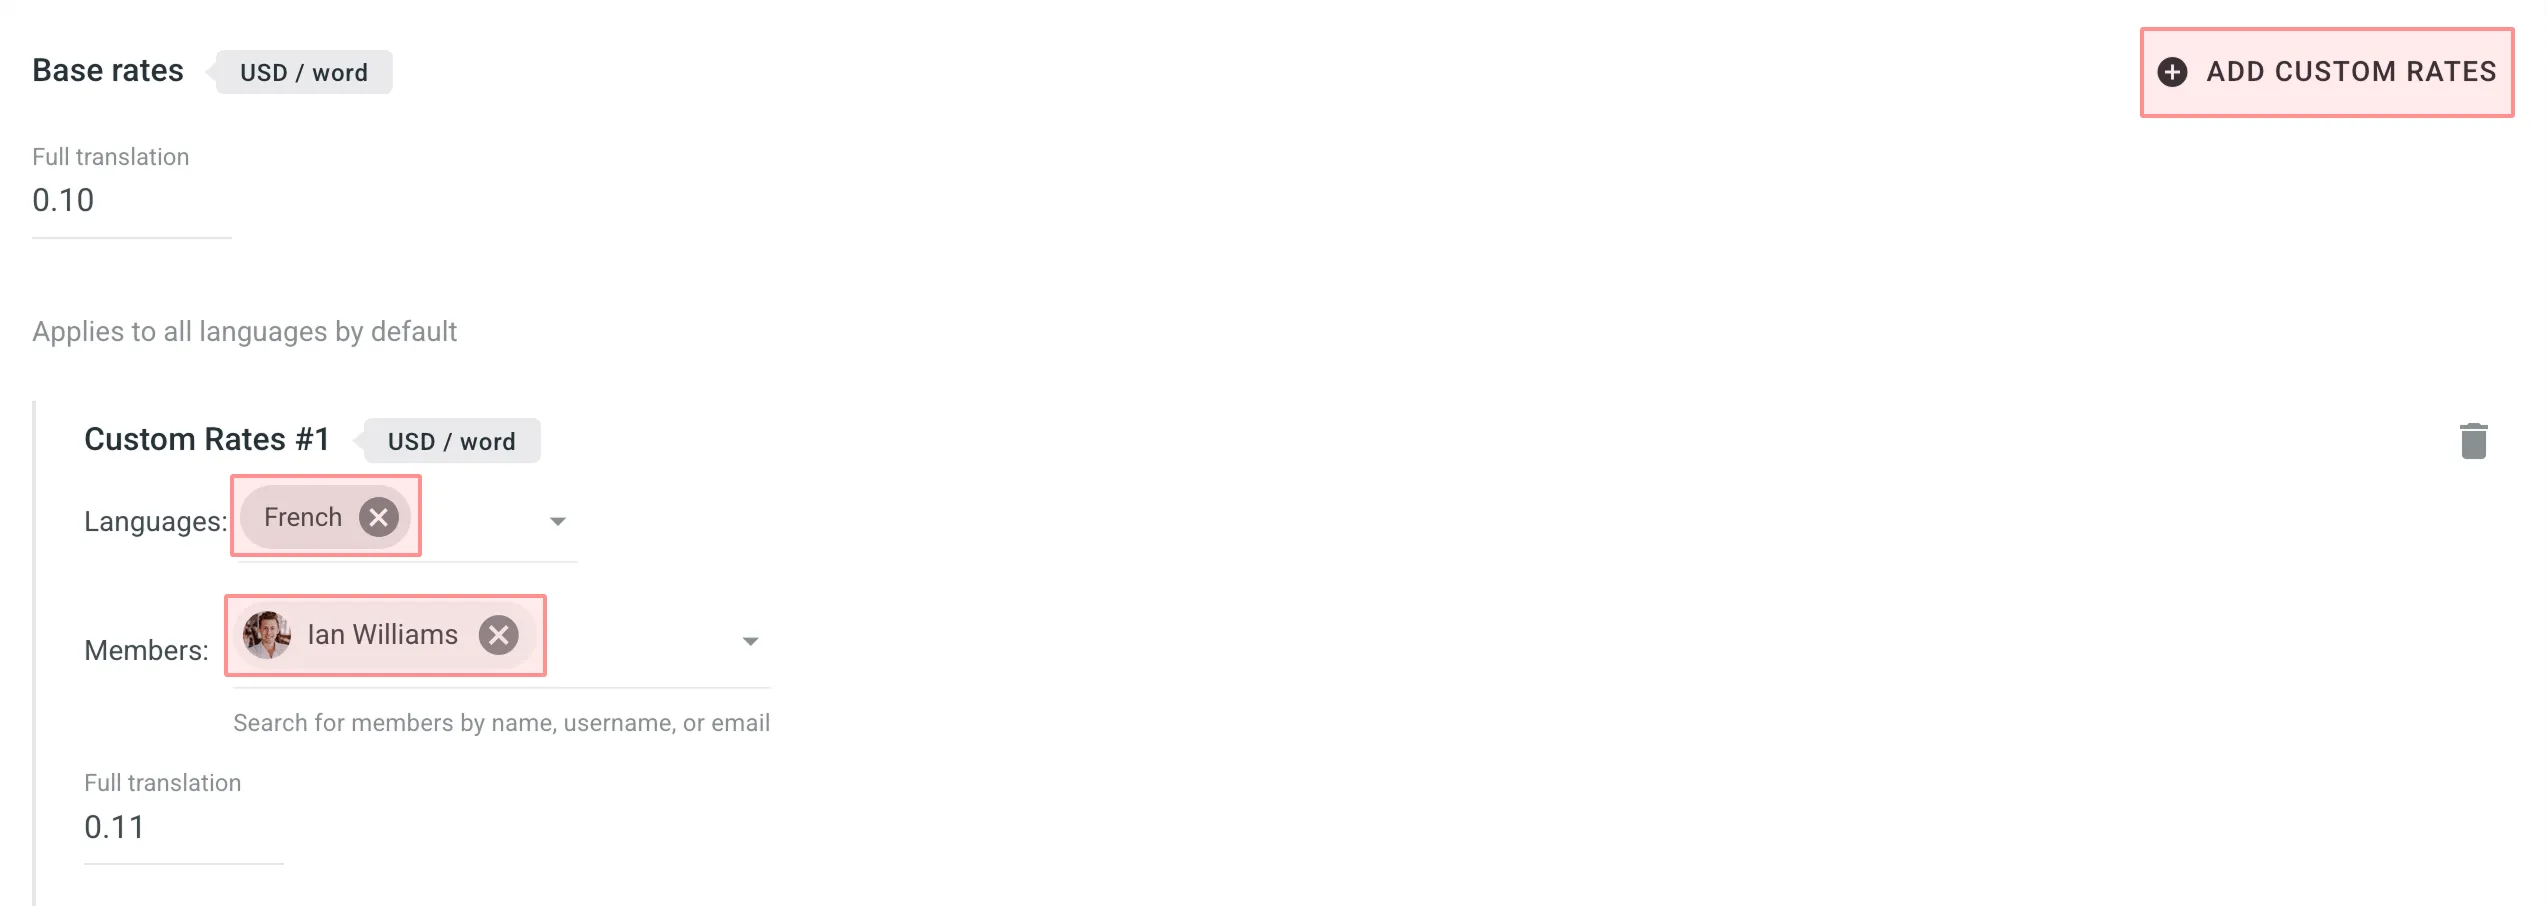
In addition to base rates that are applied to all languages and users by default, you can add custom rates for specific languages and users. To add custom rates, click Add custom rates.
To select the languages and members for custom rates, click the drop-down menus, and select the ones you need. You can create as many custom rates as you need.
When the Translation Cost report is generated, it displays a comprehensive breakdown of costs, savings, and work types.
- Total – The final calculated translation and validation cost (including TM, MT, and AI savings, weighted units, and auto-translated units).
- User and Language Totals – Below the main summary, the report splits data based on your selected Group by filter:
- Group by Member – Shows the total cost incurred by each individual translator or proofreader, with language subtotals nested underneath.
- Group by Language – Shows the total cost for each target language, with individual translator or proofreader subtotals nested underneath.
- Subtotals – Detailed metrics provided for each target language or user block:
- Translation & post-editing – The cost of translations.
- Proofreading – The cost of approvals.
- Savings – The financial amount saved by leveraging matches from TM, MT, or AI.
- Weighted Words / Strings / Characters / Characters with Spaces – The adjusted unit count after applying repetition and fuzzy match discount schemes, reflecting the actual translation effort.
- Auto-translated Words / Strings / Characters / Characters with Spaces – The total number of units that were already populated via auto-translation.
Within each user or language section, the report generates a breakdown table containing the following columns:
- Match type – The specific category and percentage range applied to the text.
- Contribution Words / Strings / Characters / Characters with Spaces – The raw number of units handled within that specific row type.
- Weighted Words / Strings / Characters / Characters with Spaces – The adjusted unit volume based on your Net Rate Scheme rules.
- Rate per unit – The specific price paid per single unit for that match or approval type.
- Price – The total cost for that row, calculated based on the unit count and assigned rate.
By default, with Use category-based approval rates enabled, all translations and approvals are grouped together by their origin category. A separate proofreading table is not shown; instead, approvals appear as rows within the respective match blocks:
- No Match – Units translated from scratch with no leverage from TM, MT, or AI (calculated at the full translation rate).
- TM match – Units matched against the Translation Memory. This includes distinct rows for translations (e.g.,
101% (perfect),100%,99-85%) and their respective approvals (e.g.,Approval 101% (perfect),Approval 100%). - MT match – Units matched against Machine Translation engines. Includes rows for translations (e.g.,
100%,99-94%) and a dedicatedApprovalrow for validations within this category. - AI match – Units matched against AI suggestions. Includes rows for translations (e.g.,
100%,99-94%) and a dedicatedApprovalrow for validations within this category. - Other translations match – Units matched against existing translations from other users. Includes rows for translations (e.g.,
100%,99-94%) and a dedicatedApprovalrow for validations within this category. - Total – Summarizes all translated, weighted, and approved units for that specific section.
To download the Translation Cost report for offline analysis or accounting, click Export and select your preferred format (CSV, XLSX, or JSON).
Use this report to evaluate the translation quality of auto-translation methods (AI, MT, and TM) used in your project and identify the most efficient ones.
This report analyzes the post-editing effort required for auto-translated strings. It compares the initial auto-translation against the final approved translation to calculate a Match Score. This helps you identify which AI prompts or MT engines require the least amount of human editing, allowing you to adjust your workflow and increase the usage of the best-performing methods.
The Match Score metric is calculated at the character level. The report unit you select (Strings, Words, Characters, or Characters with spaces) determines how the results are displayed (e.g., if you select Strings, the entire source string is placed in a category based on its total match score).
- Includes only source strings that have a translation added via auto-translation which was subsequently approved.
- The report considers auto-translations added within the selected Time period, regardless of when they were approved.
- If multiple auto-translations exist for a string, each is included with its match score.
To get the most actionable insights from this report, we recommend the following flow:
- Auto-translate – Apply auto-translation to your source content using AI, MT, or TM.
- Post-edit & Approve – Have your proofreaders review the auto-translated strings. They should fix any errors or stylistic issues (post-editing) and approve the final versions.
- Measure Accuracy – Generate the Auto-Translation accuracy report.
- Optimize – Identify which AI prompt, MT engine, or TM required the least amount of human editing. Update your workflow to use that high-performing method for future translations.
You can generate an Auto-Translation accuracy report based on the following filters:
- Task: Not selected, All Tasks, or a specific task (available only if the project has tasks).
- Language: All, or specific language.
- Time period: All time, Today, Yesterday, Last 7 days, Last 30 days, Last month, or Custom range. This filter selects the range of when the strings were auto-translated.
- Files: All files or Selected files.
- Labels: Not selected, Strings with selected labels, or Strings without selected labels (available only if the project has labels).
Additionally, using the report’s Settings, you can configure Match Score Categories. These settings determine how the graph groups translations that were edited. For example, if you set a category for 99-90%, source strings where the approved translation matches the auto-translation within that range will be grouped together. Anything below your lowest defined match category will be treated as No Match (New Translation).
To generate the Auto-Translation accuracy report, follow these steps:
- Select the preferred report unit (words, strings, characters, or characters with spaces).
- Select the preferred way to group the histogram data (Day or Month).
- When grouped by Day, the stacked histogram will have more bars, giving a more granular, day-by-day view.
- When grouped by Month, the data is displayed in fewer, broader monthly segments.
- (Optional) Select the task if you want to generate a report based on work done within all or specific tasks. Alternatively, leave it as Not selected to generate a report based on a wider content scope.
- Select the preferred language.
- Select the Time period.
- (Optional) Select Files to specify the source content. You can choose All files or Selected files.
- (Optional) Select Labels to filter strings based on their labels. You can choose Strings with selected labels or Strings without selected labels.
- (Optional) Clear Save to archive if you don’t want to save the report to the Archive.
- Click Settings to configure your Match Score Categories.
- Click Generate.
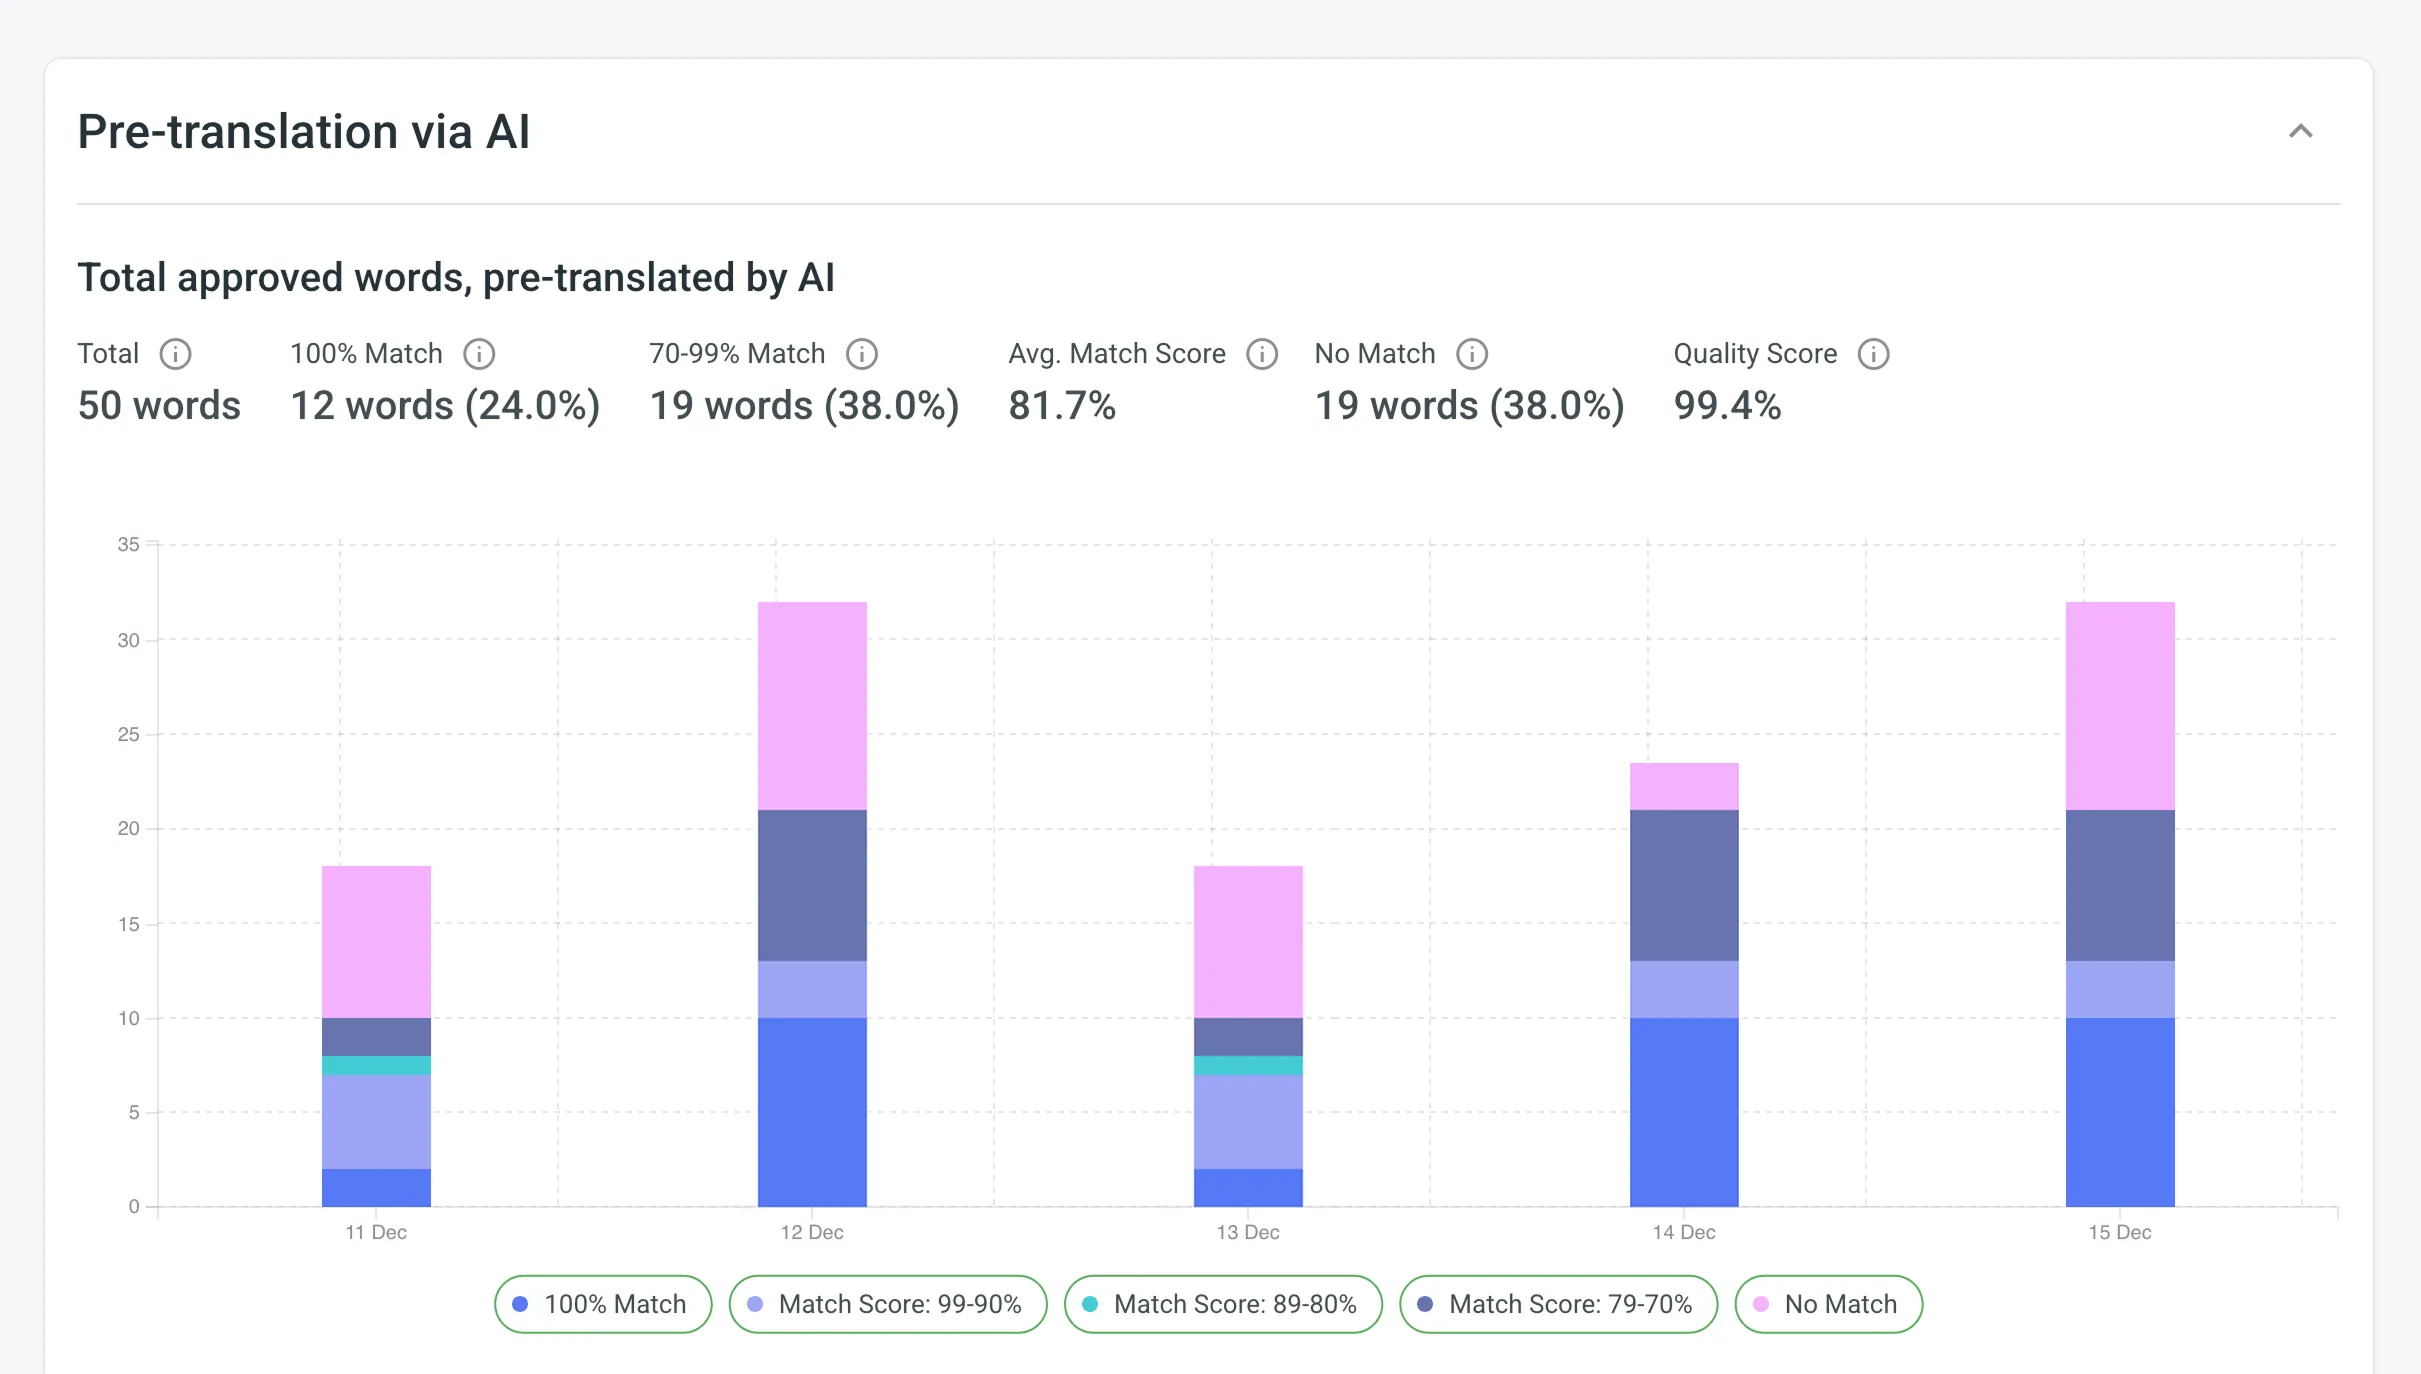
When the report is generated, you will see the information grouped into auto-translation methods (via AI, MT, and TM):
- Auto-translation via AI:
- Total approved words, auto-translated by AI
- Separate graphs for each prompt (maximum 10 prompts displayed)
- Auto-translation via MT:
- Total approved words, auto-translated by MT
- Separate graphs for each MT engine (maximum 10 engines displayed)
- Auto-translation via TM:
- Total approved words, auto-translated by TM
Each section displays the volume of source content, broken down by the following key metrics. (For this explanation, we assume Strings was selected as the report unit):
- Total – The total number of source strings to which translations were added via auto-translation and subsequently approved. This includes strings approved without changes and strings where a proofreader added a corrected translation that was then approved.
- 100% Match – The number of source strings where the approved translation matches the translation added via auto-translation exactly (100%).
- Match Score Ranges (e.g., 70-99% Match) – The number of source strings where the approved translation matches the auto-translation within the configured percentage range. This indicates that a proofreader edited the auto-translation, but the final approved version remains similar to the original suggestion.
- Avg. Match Score – The average percentage of similarity between the initial auto-translations and the final approved texts. A higher percentage means the auto-translations were accurate and required fewer edits.
- No Match – The number of source strings where the approved translation differs from the auto-translation by more than the lowest percent in your configured match score categories. In these cases, the translation was changed so significantly during proofreading that it is treated as a complete rewrite (a new translation).
- Quality Score – Measures overall quality based on the average match score achieved for the translated content. It is calculated as follows:
100 - ((Unedited + (Edited * (100 - Avg. Match Score))) / Total)
The Stacked Histogram below the metrics visualizes the distribution of these categories over time. Each bar represents the volume of source units processed, stacked by their quality category (e.g., 100% Match, Match Score: 99-90%, No Match).
To download the Auto-Translation accuracy report, click Export and select the preferred export format (CSV, XLSX, or JSON).
Use this report to evaluate the translation quality of individual translators in your project and identify top performers.
This report analyzes the post-editing effort required for translations submitted by human translators. It compares each translator’s initial translation against the final approved version to calculate a Match Score. This helps you identify translators who consistently produce high-quality work requiring minimal corrections, as well as those who may benefit from additional guidance or training.
The Match Score metric is calculated at the character level. The report unit you select (Strings, Words, or Characters) determines how the results are displayed (e.g., if you select Strings, the entire source string is placed in a category based on its total match score).
- Includes only source strings that have a translation submitted by a human translator which was subsequently approved.
- The report considers translations added within the selected Time period, regardless of when they were approved.
- If multiple translations exist for a string, each is included with its match score.
To get the most actionable insights from this report, we recommend the following flow:
- Translate – Have your translators translate the project content.
- Proofread & Approve – Have your proofreaders review the translations. They should fix any errors or stylistic issues (post-editing) and approve the final versions.
- Measure Accuracy – Generate the Translator Accuracy report to see how much the proofreaders had to edit each translator’s work.
- Feedback – Use the findings to provide targeted feedback. Translators with high 100% Match rates are your top performers, while high No Match rates might indicate a need for better glossary adherence or style guide training.
You can generate a Translator Accuracy report based on the following filters:
- Users: All or selected users.
- Language: All or specific language.
- Time period: All time, Today, Yesterday, Last 7 days, Last 30 days, Last month, or Custom range. This filter selects the range of when the translations were added.
- Files: All files or Selected files.
- Labels: Not selected, Strings with selected labels, or Strings without selected labels (available only if the project has labels).
Additionally, using the report’s Settings, you can configure Match Score Categories. These settings determine how the graph groups translations that were edited. For example, if you set a category for 99-90%, source strings where the approved translation matches the initial translation within that range will be grouped together. Anything below your lowest defined match category will be treated as No Match (New Translation).
To generate the Translator Accuracy report, follow these steps:
- Select the preferred report unit (words, strings, characters, or characters with spaces).
- (Optional) Select one or more users if you want to generate the report for specific translators only. Otherwise, choose All to include everyone.
- Select the preferred language or choose All if you want to include every target language.
- Select the Time period.
- (Optional) Select Files to specify the source content. You can choose All files or Selected files.
- (Optional) Select Labels to filter strings based on their labels. You can choose Strings with selected labels or Strings without selected labels.
- (Optional) Clear Save to archive if you don’t want to save the report to the Archive.
- Click Settings to configure your Match Score Categories.
- Click Generate.
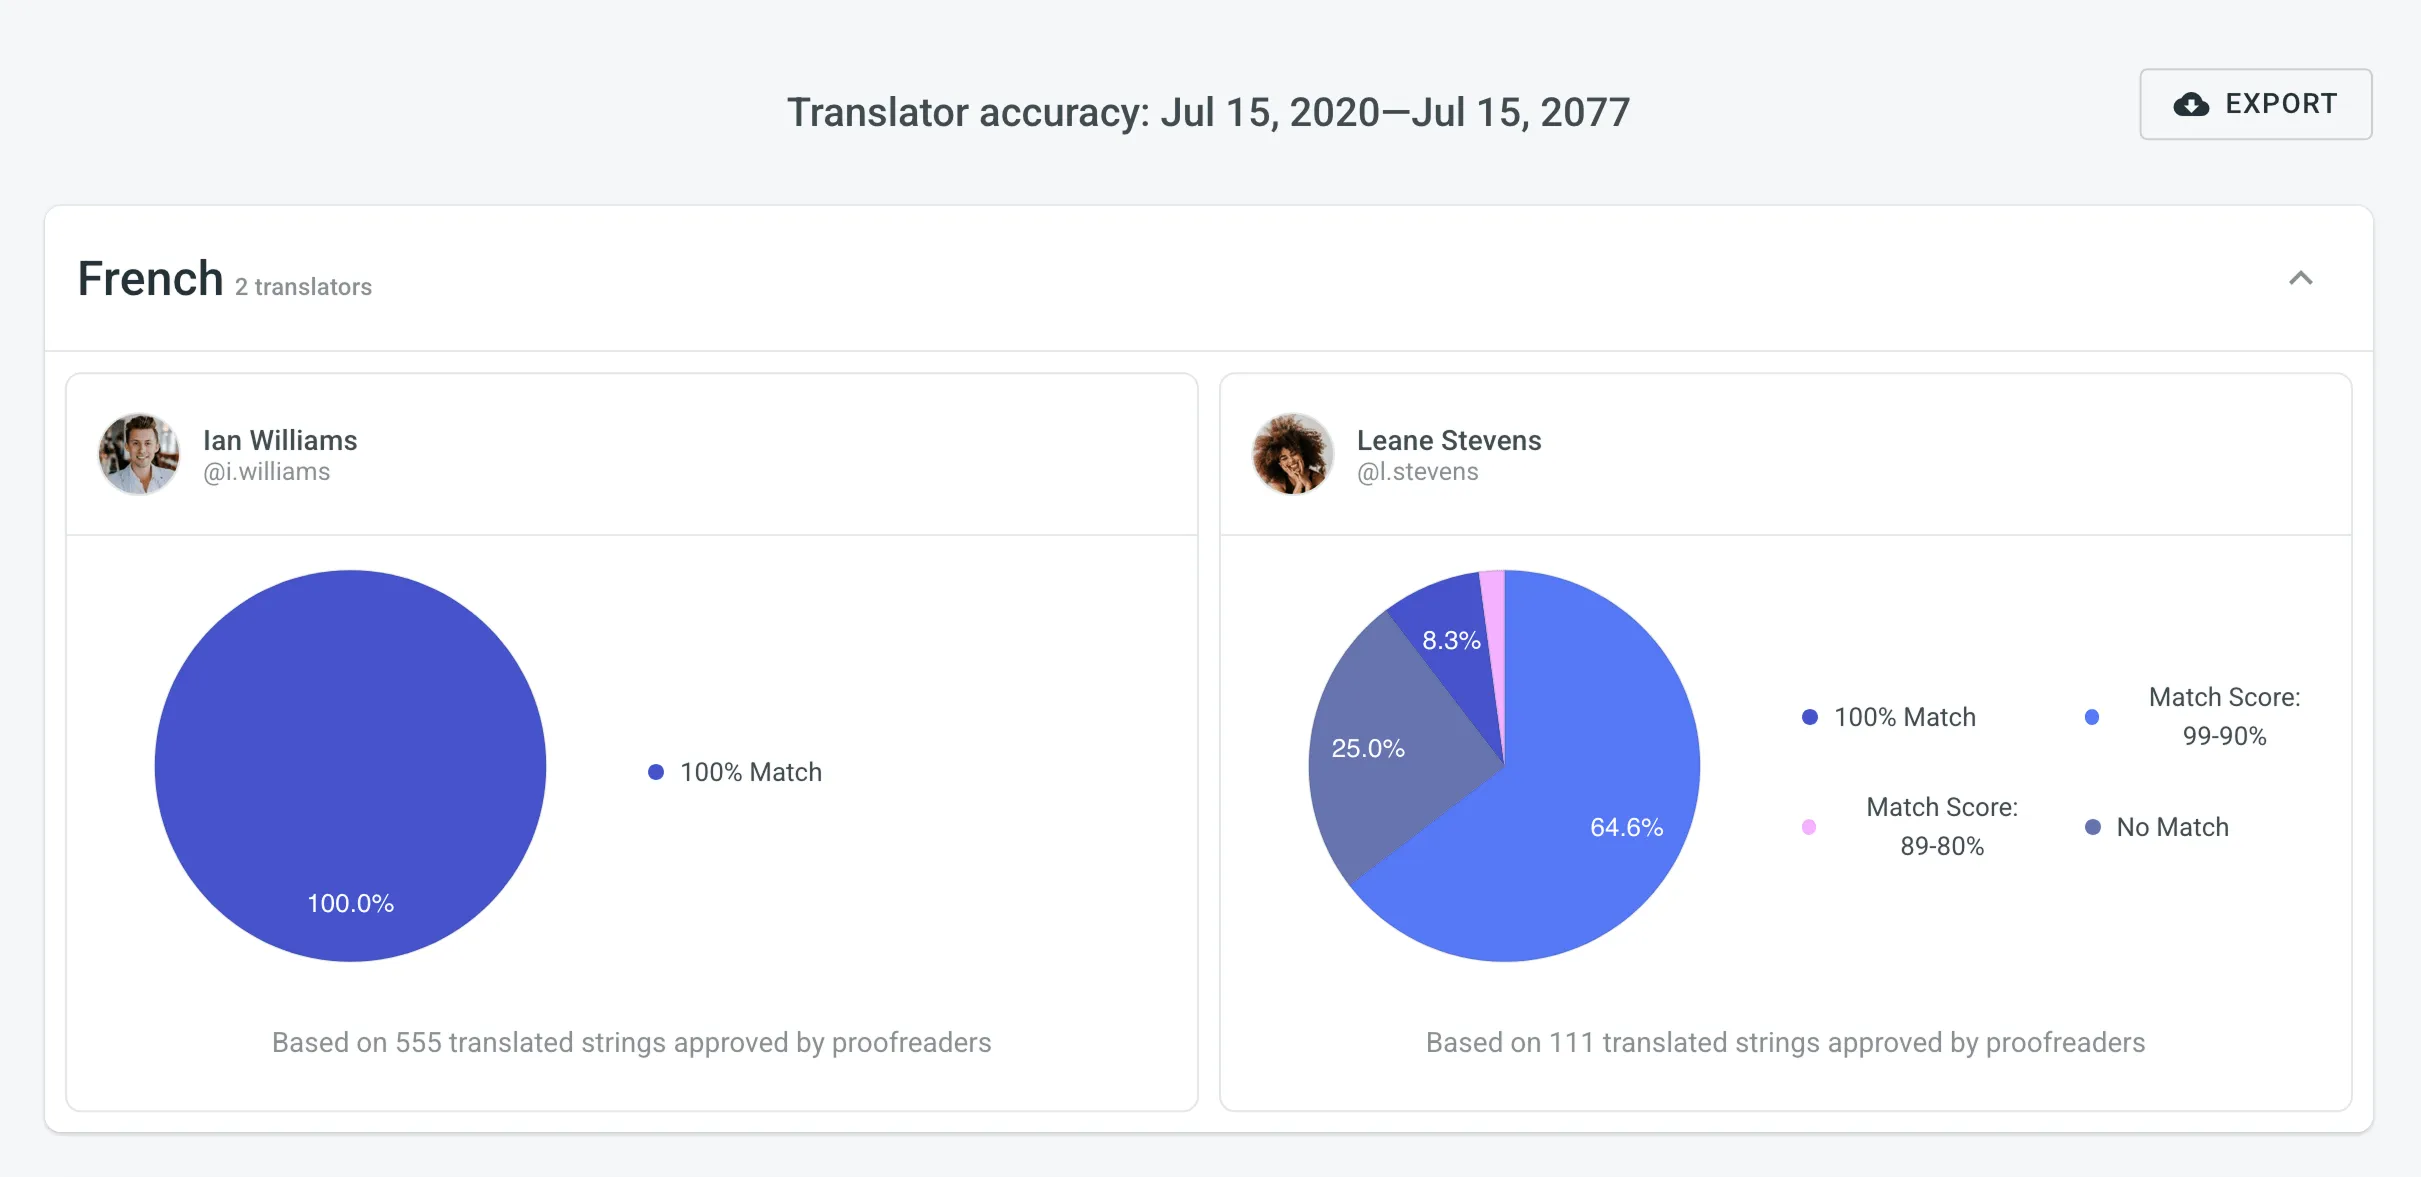
When the report is generated, you will see the information grouped by language, and each translator is listed with their individual statistics.
In each section, the data is displayed as a Pie Chart. The chart visualizes the proportion of source content based on how closely the translator’s initial work matched the final approved version:
- 100% Match – The number of source units where the approved translation matches the translator’s initial translation exactly (approved without edits).
- Match Score Ranges (e.g., 99-90% Match) – The number of source units where the approved translation is an edited version of the translator’s work but remains similar within the configured percentage range.
- No Match – The number of source units where the approved translation differs significantly from the translator’s initial work (below the lowest configured match category). In these cases, the translation was changed so significantly during proofreading that it is treated as a complete rewrite (a new translation).
To download the Translator Accuracy report, click Export and select the preferred export format (CSV, XLSX, or JSON).
Use this report to calculate the cost of work based on the time contributors spend on tasks. This report is particularly useful when paying translators and proofreaders by the hour rather than by the volume of content (e.g., words).
The report uses the time logged by contributors directly in a task’s comments.
You can generate a Time Spent report based on the following filter parameters:
- Group by: Member, Language, or Tasks.
- Time period: All time, Today, Yesterday, Last 7 days, Last 30 days, Last month, or Custom range.
- Tasks: Not selected, All Tasks, or multiple specific tasks.
- Language: All or a specific target language.
- Type: All types, Translate, Proofread, Translate by vendor, or Proofread by vendor.
- Users: All users or specific users.
To generate the Time Spent report, follow these steps:
- Select the preferred currency.
- Set your rates.
- Use the available filter parameters to specify the report data you’re interested in.
- (Optional) Clear Save to archive if you don’t want to save the report to the Archive.
- Click Generate.
You can set the hourly prices for work done by contributors in the project. Unlike the Translation Cost report, the unit for the Time Spent report is fixed to hour.
In the Base Rate section, you can set the hourly rate that will be applied to all work types (translation and proofreading) done in the project. This rate serves as the default for all languages and members.
In addition to the base rate that is applied to all languages and users by default, you can add custom rates for specific languages and users. To add custom rates, click Add custom rates.
To select the languages and users for custom rates, click the drop-down menu, and select the ones you need. You can create as many custom rates as you need.
If you plan to work with multiple rate configurations, save them as templates by clicking Save as > New rates template, then specify the template name and click Save.
Click Templates to view and manage your saved rate templates.
When the Time Spent report is generated, it displays the following details:
- Total - The total calculated cost and total time spent for the selected time period.
- User/Language/Task Totals - The report shows totals for each member, language, or task, depending on the selected Group by filter.
Below the summary, the report shows a detailed breakdown in a table format:
- Language – The target language for the work performed.
- Time Spent – The total time logged by the contributor for the work in that language.
- Rate per hour – The hourly rate applied (based on your configured Base Rate and Custom Rates).
- Price – The total cost calculated for the work in that language.
To download the Time Spent report, click Export and select the preferred format (CSV, XLSX, or JSON) for further analysis or record-keeping.
Use this report to get a detailed overview of task management within your project. It allows you to analyze workload distribution, compare creation and resolution rates, track team performance and efficiency, monitor task completion times, and review associated costs.
The Task Usage report has the following global filters that are applied to all sub-reports by default:
- Group by: Language or Type.
- Time period: All time, Today, Yesterday, Last 7 days, Last 30 days, Last month, or Custom range.
- Language: All or a specific target language.
- Type: All types, Translate, Proofread, Translate by vendor, or Proofread by vendor.
- Created by: All members or a specific member.
Each sub-report below has its own set of filters that are pre-populated from these global settings but can be individually adjusted. This allows you to start with a broad overview and then narrow the scope to specific data sets for each type of analysis.
To download reports for further analysis or record-keeping, click Export and select the preferred format (CSV, XLSX, or JSON).
In the reports that feature interactive graphs, you can hover over data points for more detailed information, such as daily or monthly totals for each category.
This section helps you understand the volume and current status of tasks across your project. You can generate a Workload report based on the following filter parameters:
- Group by: Language, Type, or User.
- Time period: All time, Today, Yesterday, Last 7 days, Last 30 days, Last month, or Custom range.
- Language: All or a specific target language.
- Type: All types, Translate, Proofread, Translate by vendor, or Proofread by vendor.
- Created by: All members or a specific member.
- Assignee: All members or a specific member.
The primary metrics show a snapshot of your project’s workload, including:
- Total tasks (period): The number of tasks found within the selected period.
- To Do: The number of tasks that have not yet been started.
- In Progress: The number of tasks that are currently being worked on.
- Done: The number of tasks where all work has been completed but are not yet closed.
- Closed: The number of tasks that have been completed and formally closed.
- Active tasks volume: The total volume of content (e.g., words) in all tasks that are not in a Closed state.
- Throughput task volume: The total volume of content (e.g., words) in all tasks that are in a Done or Closed state within the selected period.
For a more granular view, you can expand the Breakdown by languages section to see a table of these metrics for each target language.
This section helps you compare the rate of task creation against the rate of task resolution over time, which is useful for monitoring your team’s throughput and managing backlogs.
You can generate a Created vs Resolved report based on the following filter parameters:
- Group by: Language or Type.
- Time period: All time, Today, Yesterday, Last 7 days, Last 30 days, Last month, or Custom range.
- Language: All or a specific target language.
- Type: All types, Translate, Proofread, Translate by vendor, or Proofread by vendor.
- Created by: All members or a specific member.
This section displays the following primary metrics:
- Created: The total number of tasks created within the selected time period.
- Resolved: The total number of tasks that were resolved (i.e., moved to a Done or Closed state) within the selected time period.
Below the metrics, a line graph visualizes the cumulative number of created versus resolved tasks over time, allowing you to see trends at a glance. Additionally, you can expand the Breakdown by languages section to see the number of created and resolved tasks for each target language in a table format.
This section helps you evaluate team performance and efficiency by tracking how tasks are completed in relation to their due dates.
You can generate a Task Performance report based on the following filter parameters:
- Group by: Language or Type.
- Time period: All time, Today, Yesterday, Last 7 days, Last 30 days, Last month, or Custom range.
- Language: All or a specific target language.
- Type: All types, Translate, Proofread, Translate by vendor, or Proofread by vendor.
- Created by: All members or a specific member.
- Assignee: All members or a specific member.
This section displays the following primary metrics:
- Total with Due Date: The total number of tasks that have a due date set within the selected period.
- Total Open Overdue: The number of tasks that are currently past their due date but are not yet closed.
- Closed Overdue: The number of tasks that were completed and closed after their due date.
- Closed on Time: The number of tasks that were completed and closed on or before their due date.
- On-time rate: The percentage of tasks closed on or before their due date out of all closed tasks within the selected period.
Below the metrics, a stacked bar chart visualizes the performance over time, comparing the number of tasks Closed Overdue against those Closed on Time. For a more detailed view, you can expand the Breakdown by languages section to see a performance breakdown for each target language.
This section provides detailed analytics on how long it takes for tasks to move from creation to completion, helping you identify potential bottlenecks in your workflow.
You can generate a Task Completion Time report based on the following filter parameters:
- Group by: Language or Type.
- Time period: All time, Today, Yesterday, Last 7 days, Last 30 days, Last month, or Custom range.
- Language: All or a specific target language.
- Type: All types, Translate, Proofread, Translate by vendor, or Proofread by vendor.
- Created by: All members or a specific member.
- Assignee: All members or a specific member.
- Size (words): Any, or a custom range of words.
This section displays the following primary metrics:
- Avg. completion time: The average time taken for tasks to be completed from the moment of creation.
- Median: The median time taken for task completion, representing the typical time for most tasks.
- 80th percentile: The time within which 80% of tasks are completed. This helps to understand the upper range of completion times while ignoring extreme outliers.
- Max. completion time: The longest time taken to complete any single task in the selected set.
- Avg. waiting time: The average time a task spends in a To Do state before work begins.
- Avg. overdue time: The average amount of time by which tasks were completed past their due date. This is calculated only for tasks that were closed overdue.
- Avg. active work time: The average time spent actively working on a task. This excludes the initial time a task spends in the To Do state.
The primary metrics are also available in the expandable Breakdown by languages section, which shows a detailed table of completion and waiting times for each target language.
This section helps you review and analyze the financial costs associated with tasks in your project.
This report totals the costs for all tasks that have either a recorded Cost Estimate or Translation Cost. The actual cost from the Translation Cost report is always prioritized. To include a task’s financial data in this summary, you must first generate a cost or estimate report for that specific task.
You can generate a Task Cost report based on the following filter parameters:
- Group by: Language or Type.
- Time period: All time, Today, Yesterday, Last 7 days, Last 30 days, Last month, or Custom range.
- Language: All or a specific target language.
- Type: All types, Translate, Proofread, Translate by vendor, or Proofread by vendor.
- Created by: All members or a specific member.
- Status: To Do, In Progress, Done, Closed, or For Approval. You can select multiple statuses at once.
This section displays the following primary metrics. If multiple currencies are used in the tasks, the costs for each will be displayed separately.
- Task costs with estimates: The total cost for all tasks within the filtered selection that have an associated estimate or actual cost.
- Task costs with estimates (active): The total cost for only the active tasks (those in a “To Do” or “In Progress” state) within the filtered selection.
For a more detailed view, you can expand the Breakdown by languages section. This table shows the number of tasks and their associated costs for each language, also broken down by total versus active tasks.
In addition to the Translation Cost report, which is based on the Contribution Raw Data and grouped by languages, you can retrieve this detailed contribution raw data using the Generate Report (Contribution Raw Data schema) or via the Raw Report Data app available on the Crowdin Store. This allows you to generate your own custom report according to your specific requirements.
The Contribution Raw Data report provides various columns depending on the selected mode (translations, approvals, or votes). Each column offers specific insights, for example source string text hash, which is useful for identifying changes in source strings despite having the same stringId. It’s important to note that multiple records can exist for the same stringId if the source hash or plural form varies.
For repeated translations by the same user on the same source string, into the same target language, the same plural form, and if the source text has not changed, only the translationId, targetUnits, and updatedAt columns will update in the report statistics. Deleted translations are also included in the count. Understanding these columns can help you better interpret the raw data and optimize your localization process.
View the available report columns and their mode applicability (i.e., translations, approvals, and votes) in the following table:
| Name | Available in Report Mode | Description |
|---|---|---|
userId | Translations, Approvals, Votes | Type: Numeric identifier of a user who added a translation. |
languageId | Translations, Approvals, Votes | Type: Target language identifier (Crowdin language code (e.g., uk)). |
stringId | Translations, Approvals, Votes | Type: Numeric string identifier in Crowdin project. |
translationId | Translations, Approvals, Votes | Type: Numeric identifier of the translation in Crowdin project. |
fileId | Translations, Approvals, Votes | Type: Numeric file identifier in Crowdin project where the source string is stored. |
filePath | Translations, Approvals, Votes | Type: Path to the file that contains the source string (e.g., /main/docs/index.md). |
pluralForm | Translations, Approvals, Votes | Type: Translation plural form (each plural form is displayed as a separate record in the report). |
sourceStringTextHash | Translations, Approvals, Votes | Type: Hash of the source string. |
mtEngine | Translations, Approvals, Votes | Type: MT engine name from which a translation was provided. |
mtId | Translations, Approvals, Votes | Type: Numeric MT engine identifier. |
tmName | Translations, Approvals, Votes | Type: Translation memory name from which a translation was provided. |
tmId | Translations, Approvals, Votes | Type: Numeric translation memory identifier. |
preTranslated | Translations, Approvals, Votes | Type: Specifies if a translation was applied via auto-translation. |
tmMatch | Translations | Type: The highest match value of the translation with other TM suggestions, if any. |
mtMatch | Translations | Type: The highest match value of the translation with other MT suggestions, if any. |
suggestionMatch | Translations | Type: The highest match value of the translation with suggestions from other translators, if any. |
sourceUnits | Translations, Approvals, Votes | Type: Specifies the number of words in the source text (available only if |
targetUnits | Translations, Approvals, Votes | Type: Specifies the number of words in the translation (available only if |
createdAt | Translations, Approvals, Votes | Type: Specifies the date when the string was initially translated. |
updatedAt | Translations, Approvals, Votes | Type: Specifies the date when the last translation was added. |
mark | Votes | Type: A vote mark that indicates how the translation rating has changed (e.g., if a translation has been voted up or down, or if the vote has been canceled). |
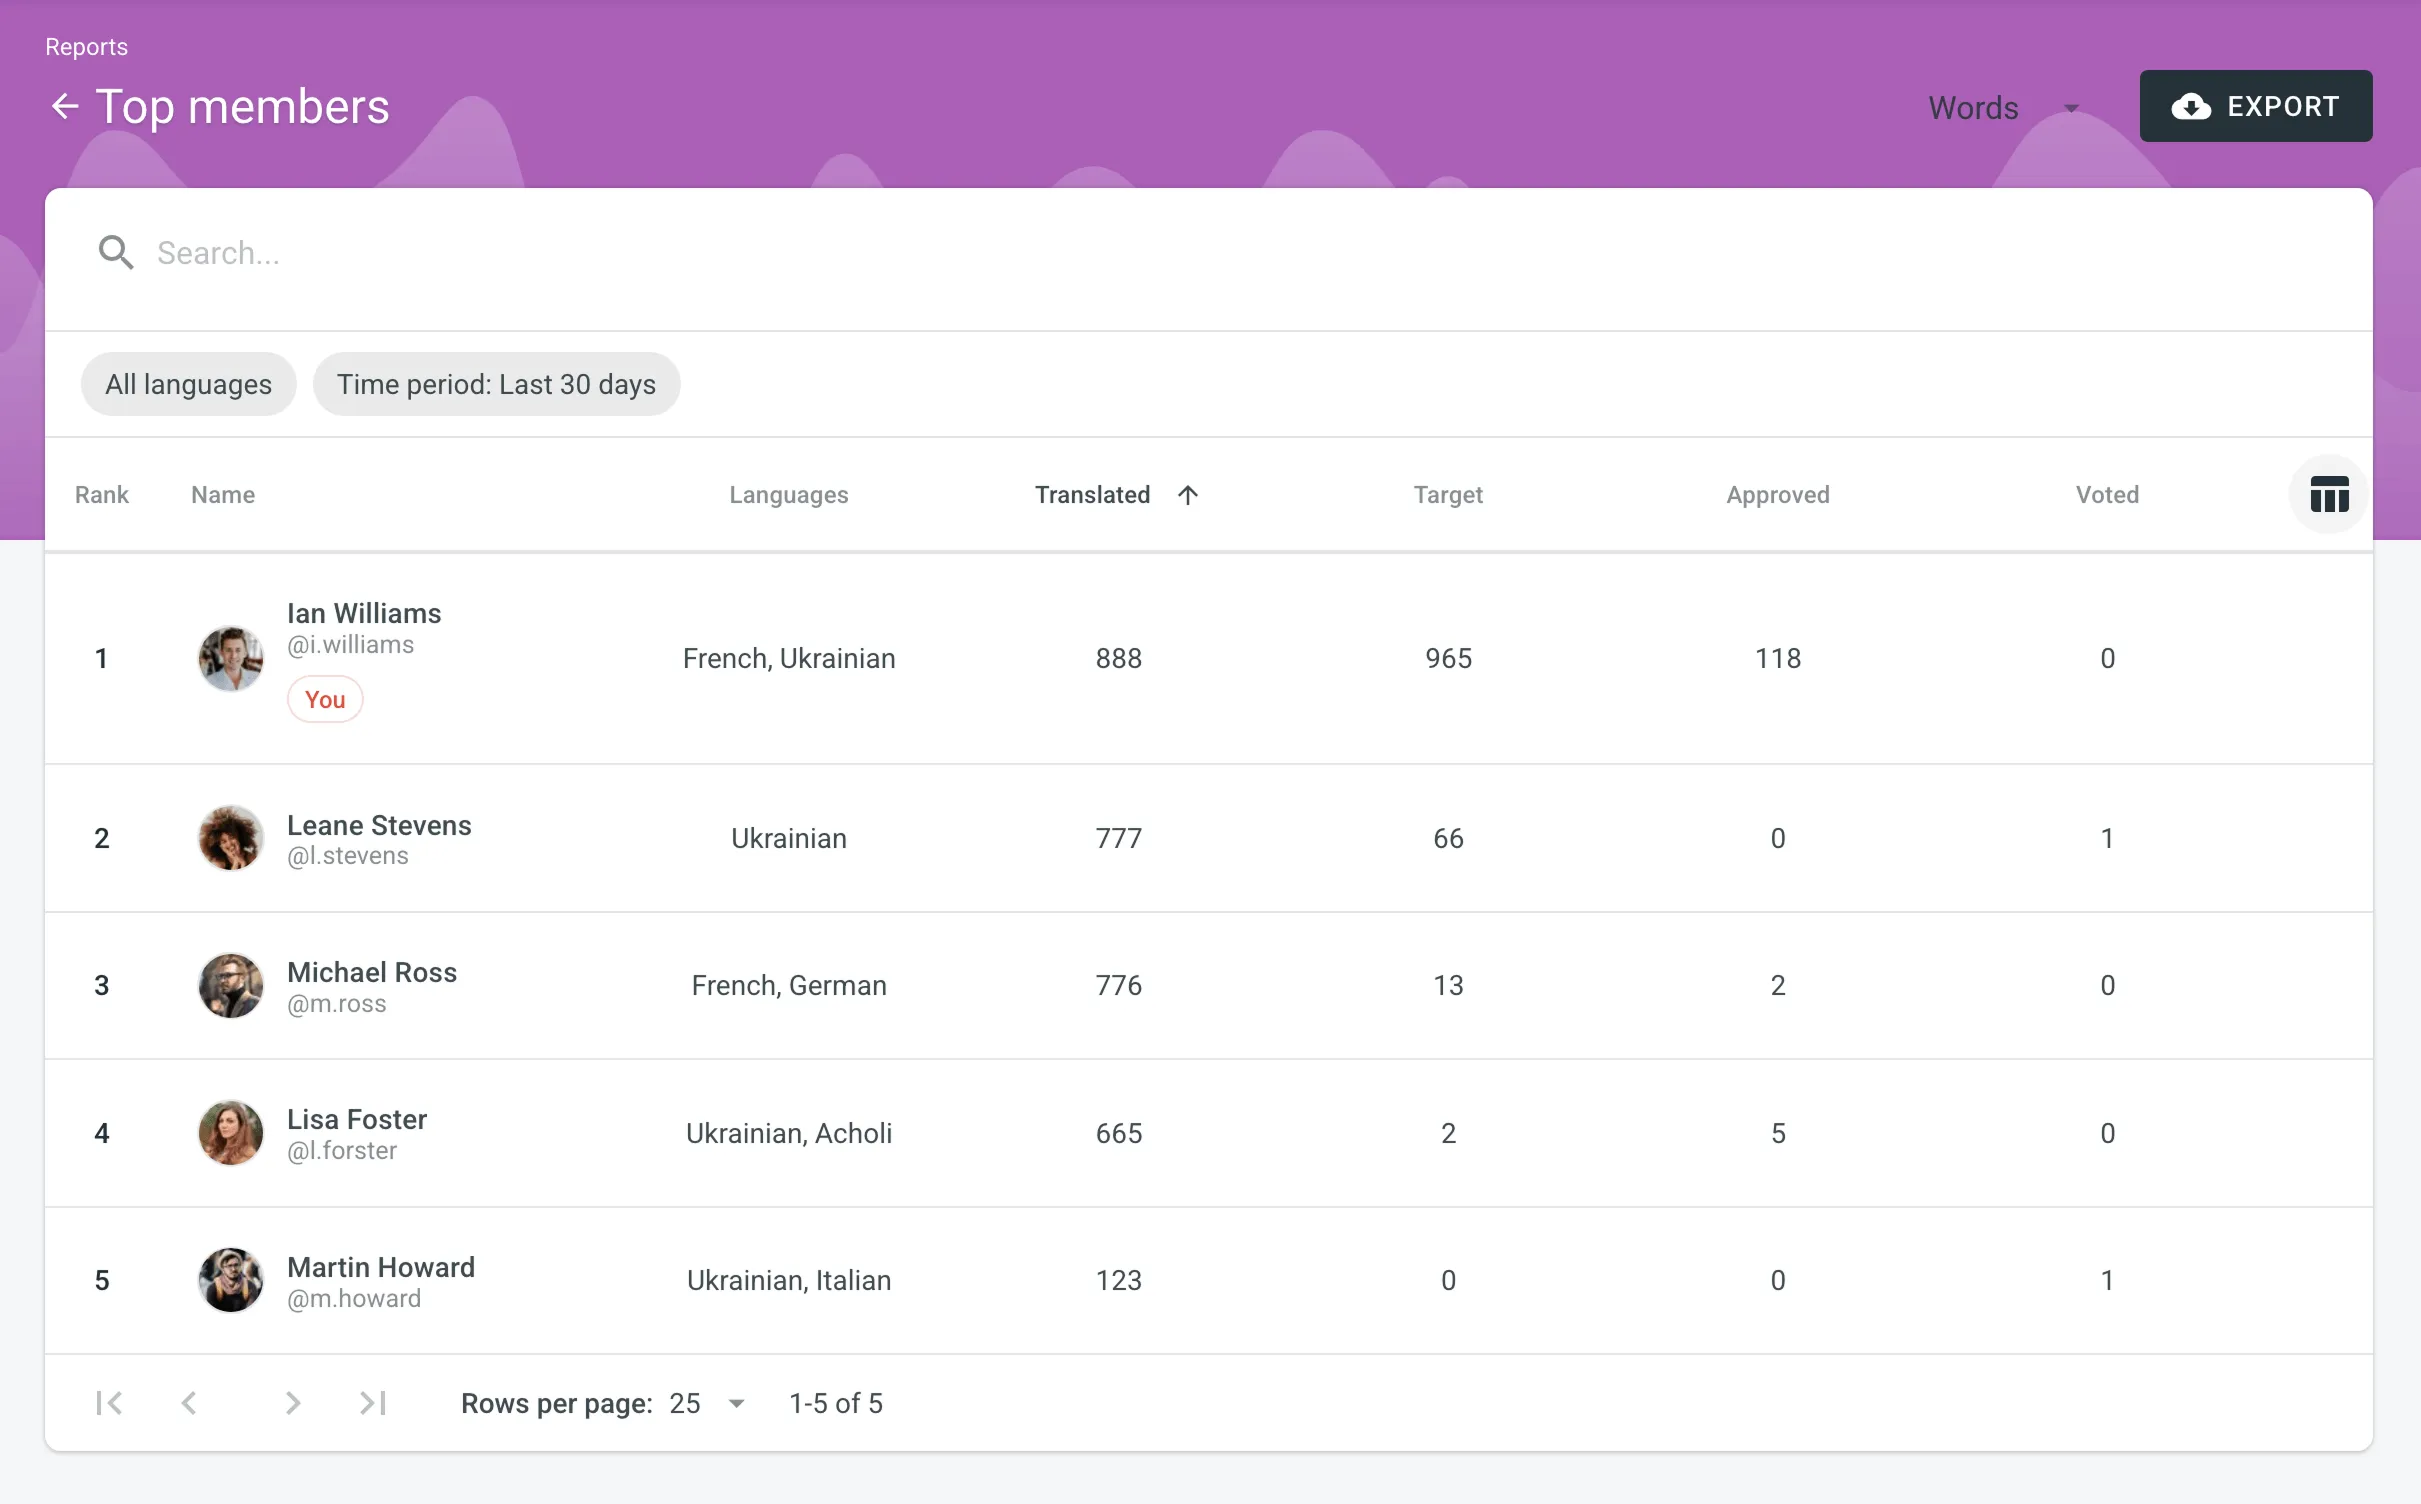
The Top Members report allows you to see who contributed the most to your project’s translation over time. This list includes all users who have ever contributed, even if they are no longer current project members.
Default parameters:
- Text unit: words
- Time period: Last 30 days
- Sorted by: translated text units. A member who translated the most is placed at the top of the list.
- Languages: all languages
- Contributors: all
The You label appears next to your own username in the report table, making it easier to identify your personal contribution.
Re-sort the members by clicking on the needed parameter. For example, if you want to analyze members by their proofreading activity, click on the Approved parameter to redo sorting.
To generate a custom list of top members, follow these steps:
- Select the preferred report unit (words, strings, characters with or without spaces).
- Select the time period for which you want to see the activity of contributors.
- To make a list of contributors for a specific language, select the language you need from the drop-down menu above the list. Alternatively, select All languages.
To find a specific member, use the search field. To open the member’s profile page, double-click on the name.
The Top Members list includes the following columns:
- Rank – contributor’s position in the list based on the currently selected sorting criteria (e.g., Translated, Approved, etc.).
- Name – contributor’s first name, last name and username.
- Languages – project languages.
- Translated – the number of translated source content units.
- Target – the number of translated content units in a target language.
This parameter is not available for the Strings content unit because the number of source and translated strings is always the same. - Approved – the number of approved content units.
- Voted – the number of votes a contributor made.
- ”+” votes received – the number of upvotes a contributor received for translations.
- ”-” votes received – the number of downvotes a contributor received for translations.
- Winning – the number of approvals a contributor received for translations.
- Given access – indicates when a member was granted access to a project.
To customize the visibility of columns in the report, click at the upper-right side of the table and select the preferred ones.
To download the Top Members report, click Export and select the preferred export format (CSV, XLSX, or JSON).
The Archive section allows you to access the records of previously generated Cost estimate and Translation cost reports, providing a convenient way to review historical data.
This section also eliminates the need to wait for a report generation to complete. You can initiate a report generation and return to it later at your convenience. Within the Archive, you can review the report summary and, if necessary, download it in various supported file formats.
Each project within an organization has its own independent archive section with previously generated reports available only to project members with manager permissions (or higher).
Reports generated by translators based on their contributions are not added to the archives.
To view the summary of the previously generated reports (i.e., archive records), follow these steps:
- Open your project and go to Reports > Archive.
- Click on the name of the needed archive record.
- Once you open the archive report record, you can view all the needed data.
To export the previously generated reports, follow these steps:
- Open your project and go to Reports > Archive.
- Click (or right-click) on the needed report in the list.
- Click on the preferred file format to export.
To delete the previously generated reports, follow these steps:
- Open your project and go to Reports > Archive.
- Click (or right-click) on the needed report in the list.
- Click Delete.